
Research
Top 14 Best Research Analytics Tools for Business Insights
Aug 09, 2024
Research analytics tools have become essential for businesses looking to gain a competitive advantage. These tools enable companies to analyze vast amounts of data, discover actionable insights, and make the best-informed decisions that drive growth and innovation. Without these powerful analytics tools, businesses would struggle to interpret complex datasets, potentially leading to missed opportunities and costly mistakes.
In this guide, we'll highlight how they improve decision-making, streamline processes, and improve your overall business performance.
14 Best Research Analytics Tools for Business
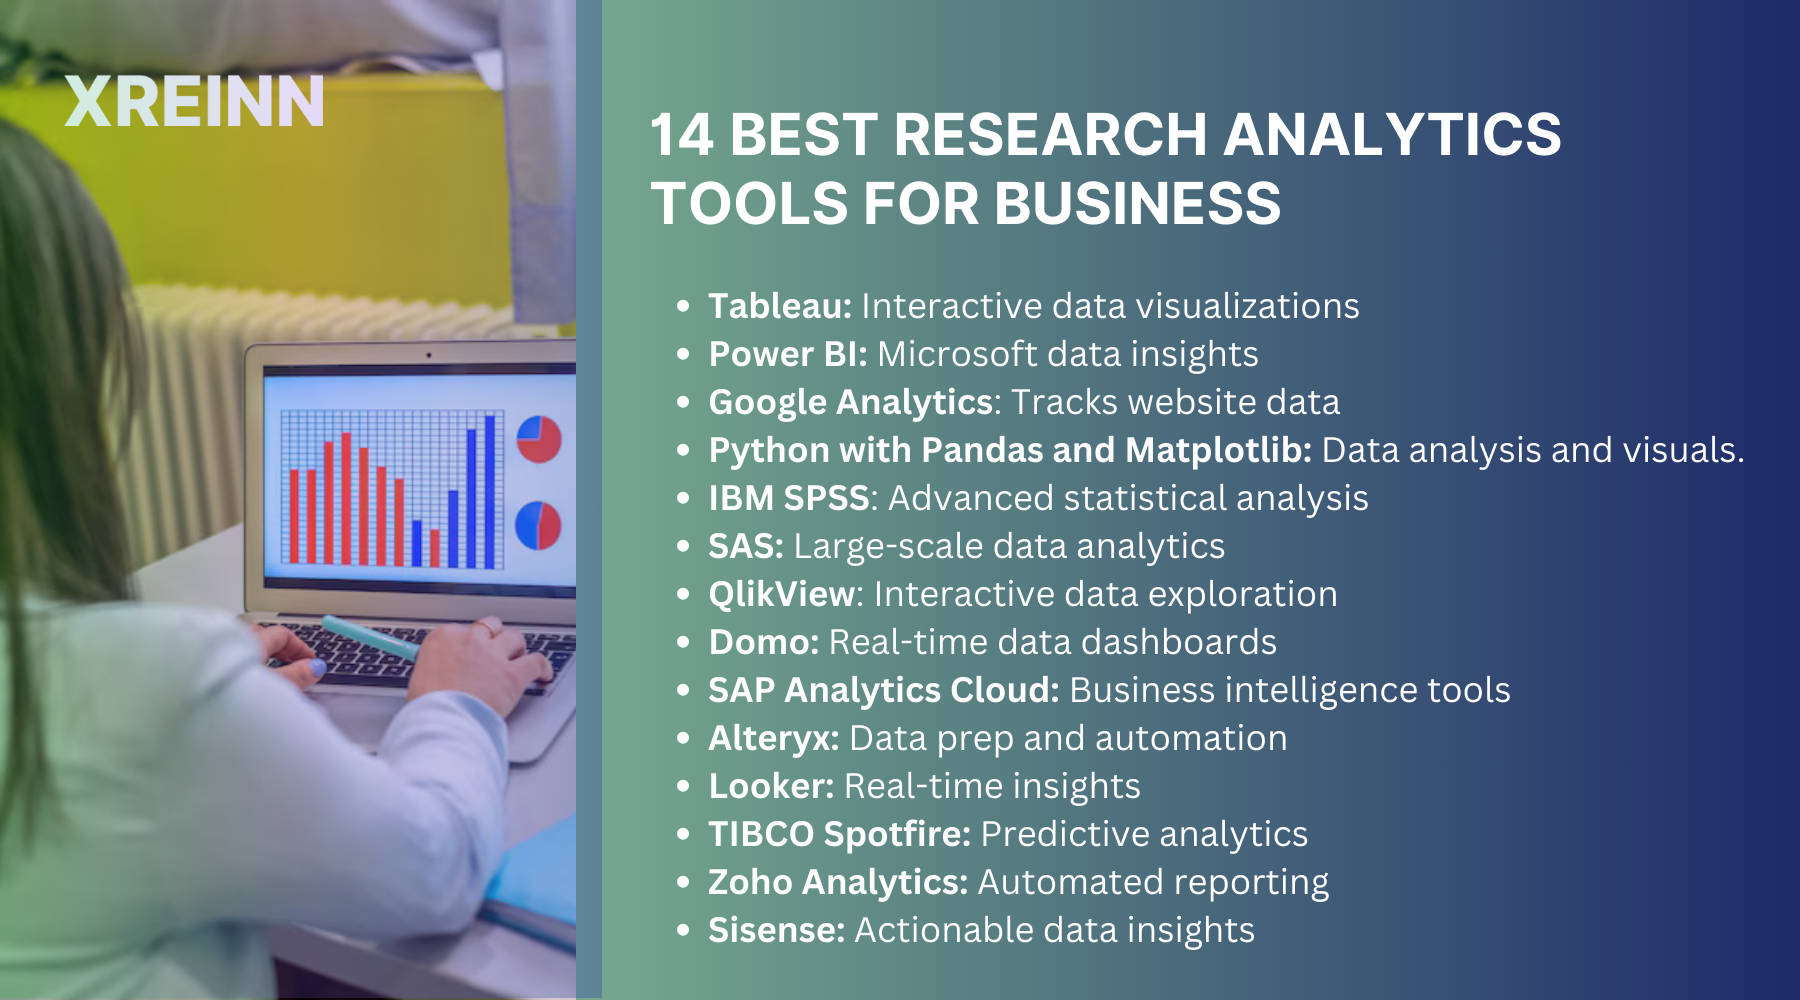
1. Tableau
Tableau is a powerful data visualization tool that enables you to create stunning interactive dashboards and visualizations. Its intuitive interface allows you to drag and drop data elements, making it an ideal choice for professionals who want to convey complex data insights in an easily digestible format.
How Does It Work?
Tableau connects seamlessly to various data sources, from spreadsheets to cloud services. Once your data is connected, you can use its visualization engine to create dynamic charts, graphs, and dashboards. Its drag-and-drop functionality allows you to manipulate data elements, uncover patterns, and communicate insights visually. Tableau's ability to handle large datasets ensures you can create interactive reports that captivate your audience and facilitate data-driven decision-making.
2. Power BI
Microsoft's Power BI is a business analytics tool that offers strong features for transforming raw data into meaningful insights. With its seamless integration with other Microsoft products, Power BI enables you to create visually appealing reports and share them effortlessly with your team.
How Does It Work?
Power BI integrates with various data sources, including Excel, SQL databases, and cloud services. You can transform data into interactive reports using its user-friendly interface, applying filters and calculations to derive insights.
Power BI's natural language processing capabilities allow you to ask questions about your data in plain language, making it accessible to a broader audience. The ability to create dynamic dashboards ensures you stay informed about key metrics and trends in real-time.
3. Google Analytics
Google Analytics remains a basis for businesses aiming to understand their online presence. It provides detailed insights into website traffic, user behavior, and conversion rates, empowering you to optimize your digital strategies for maximum impact.
How Does It Work?
Google Analytics works by tracking user interactions on your website. Through its tracking code, it collects data on user behavior, including page views, session duration, and conversion actions. You can create custom reports, segment audiences, and analyze user journeys using its interface. Google Analytics integration with Google Ads andSearch Console lets you understand how your online campaigns contribute to your business goals. Its ability to visualize user data helps you identify areas for improvement and refine your digital strategies.
4. Python with Pandas and Matplotlib
Python, combined with the Pandas and Matplotlib libraries, is a powerful duo for data visualization and analysis. While Python's simplicity makes it accessible, its extensive libraries provide advanced tools for handling complex data sets and generating insightful visualizations.
How It Works
Python's Pandas library provides data structures like DataFrames, which facilitate data manipulation and analysis. You can clean, transform, and filter datasets using Pandas to prepare them for analysis. Matplotlib complements Pandas by offering tools for creating visualizations, from basic plots to complex graphs. By using Python's scripting capabilities, you can automate repetitive tasks and create custom analyses customized to your business needs. Whether conducting exploratory data analysis or building predictive models, Python equips you with the tools to uncover valuable insights.
5. IBM SPSS
IBM SPSS is a comprehensive software suite for statistical analysis, data management, and decision-making. Its user-friendly interface and advanced analytical capabilities make it a go-to choice for researchers and analysts aiming to derive actionable insights from data.
How It Works
IBM SPSS offers a wide range of statistical techniques, including regression analysis, factor analysis, and hypothesis testing. Its point-and-click interface simplifies data manipulation, allowing you to import datasets and apply various analyses effortlessly. SPSS's output includes detailed tables, charts, and reports that aid in interpreting results. Its integration with external data sources ensures you can from multiple sources within a unified environment. SPSS empowers you to make informed decisions by providing tools for data exploration, modeling, and reporting.
6. SAS (Statistical Analysis System)
SAS is a strong analytics platform offering many statistical, data mining, and predictive modeling tools. Its ability to handle large-scale data sets and complex analyses makes it a preferred choice for professionals seeking to uncover valuable business insights.
How It Works
SAS provides a suite of tools for data manipulation, analysis, and reporting. Its programming language allows you to write scripts for data processing and analysis, enabling you to perform tasks like data cleaning, transformation, and modeling. SAS's advanced analytics capabilities include regression analysis, clustering, and time series forecasting. By using SAS's tools, you can gain insights into customer behavior, market trends, and operational efficiency. The platform's scalability ensures you can analyze vast datasets and derive meaningful conclusions to drive strategic decisions.
7. QlikView
QlikView is a business intelligence platform that facilitates interactive data visualization and analysis. Its associative data model enables you to explore data relationships intuitively, making it an ideal choice for professionals seeking to uncover hidden patterns.
How It Works
QlikView's associative data model allows you to explore connections between different data points without predefined relationships. You can load data from various sources, perform data transformations, and create interactive dashboards.
QlikView's visualizations are dynamic, allowing users to filter and go in-depth into data to uncover insights. Its in-memory processing ensures fast response times, enabling real-time exploration of large datasets. By building a culture of data exploration, QlikView empowers you to discover insights that may not be apparent through traditional analysis methods.
8. Domo
Domo is a cloud-based business intelligence platform that provides real-time data access and collaboration. Its emphasis on user-friendly dashboards and integration capabilities makes it a valuable tool for professionals seeking to streamline decision-making processes.
How It Works
Domo integrates with a wide range of data sources, from databases to cloud applications, allowing you to centralize your data for analysis. Its drag-and-drop interface enables you to create customizable dashboards and reports, providing real-time insights into your business operations.
Domo's collaboration features facilitate sharing insights with team members, ensuring everyone is aligned on key metrics. You can identify opportunities, track performance, and optimize business strategies by visualizing data in real-time.
9. SAP Analytics Cloud
SAP Analytics Cloud offers a comprehensive suite of tools for business intelligence, planning, and predictive analytics. Its integration with SAP systems and user-friendly interface make it a preferred choice for organizations seeking end-to-end analytics solutions.
How It Works
SAP Analytics Cloud connects to various data sources, including SAP systems and external databases, enabling you to perform analyses across your organization. You can create interactive dashboards, reports, and visualizations using its interface to gain insights into business performance. The platform's predictive analytics capabilities allow you to build forecasting models and simulate scenarios. SAP Analytics Cloud's planning features enable you to align strategic objectives with data-driven insights, facilitating effective decision-making.
10. Alteryx
Alteryxis a data preparation and analytics platform that empowers users to blend, cleanse, and analyze data from multiple sources. Its emphasis on automation and advanced analytics makes it an invaluable tool for professionals seeking to streamline data workflows.
How It Works
Alteryx provides a visual workflow interface that allows you to build data processes without coding. You can connect to diverse data sources, perform data cleansing, and apply analytics techniques using pre-built tools. Alteryx's integration with machine learning libraries enables you to build predictive models and conduct advanced analyses. The platform's automation capabilities allow you to schedule and execute workflows, ensuring you can derive insights efficiently and consistently. Alteryx empowers you to uncover actionable insights by simplifying data preparation and analysis.
11. Looker
Lookeris a modern data platform that focuses on data exploration and visualization. Its user-centric approach and integration capabilities enable professionals to make informed decisions by accessing real-time insights.
How It Works
Looker connects to your data sources and creates a semantic layer that allows you to explore data relationships without complex queries. You can create visualizations and dashboards that provide insights into your business operations using its user-friendly interface.
Looker's integration with collaboration tools facilitates sharing insights with team members, fostering a data-driven culture. By accessing real-time insights, you can monitor key metrics, track performance, and make strategic decisions that align with your business objectives.
12. TIBCO Spotfire
TIBCO Spotfire is an analytics platform that offers tools for data visualization, predictive analytics, and real-time insights. Its ability to handle complex data sets and deliver actionable insights makes it a preferred choice for professionals seeking advanced analytics solutions.
How It Works
TIBCO Spotfire allows you to import data from various sources and create interactive visualizations that uncover patterns and trends. Its predictive analytics capabilities enable you to build models that forecast future outcomes and simulate scenarios. Spotfire's real-time analytics features allow you to monitor data streams and respond to changing conditions promptly. By using Spotfire's tools, you can gain insights into operational efficiency, customer behavior, and market trends, enabling you to make data-driven decisions that drive business success.
13. Zoho Analytics
Zoho Analytics is a cloud-based analytics platform that empowers users to create insightful reports and dashboards. Its focus on automation and user-friendly features makes it a valuable tool for professionals seeking to derive actionable insights from data.
How It Works
Zoho Analytics allows you to import data from various sources, including spreadsheets, databases, and cloud applications. You can create custom reports and dashboards using its drag-and-drop interface, applying filters and calculations to uncover insights. Zoho's AI-powered analytics capabilities provide automated insights and suggestions, helping you identify trends and opportunities. The platform's collaborative features enable you to share reports with team members and facilitate data-driven decision-making across your organization.
14. Sisense
Sisense is an end-to-end business intelligence platform that empowers professionals to transform complex data into actionable insights. Its ability to handle large-scale data sets and deliver interactive visualizations makes it a preferred choice for organizations seeking to optimize their data analysis processes.
How It Works
Sisense integrates with various data sources, enabling you to consolidate your data for analysis. Its in-chip processing architecture allows you to analyze large datasets quickly, ensuring real-time insights into your business operations. Sisense's drag-and-drop interface lets you create interactive dashboards and reports that provide valuable insights into key metrics. By leveraging Sisense's tools, you can uncover hidden patterns, track performance, and make informed decisions that drive business success.
Conclusion
Research analytics tools are no longer optional but essential for businesses aiming to succeed in today’s competitive setting. These tools enable you to transform raw data into meaningful insights, leading to smarter decisions and better outcomes. By incorporating the right analytics tools into your operations, you can uncover trends, identify opportunities, and optimize strategies that align with your goals. Whether you're aiming to improve customer experience, improve operational efficiency, or drive revenue growth, the right analytics tools can provide the insights needed to make the best decisions

Data Analytics
Jun 27, 2024Master key concepts in data analytics with practical tips to enhance decision-making and achieve success in your projects and professional growth

Data Analytics
Jul 01, 2024Learn the essential stages of the data analytics workflow to turn your data into valuable business insights and drive growth.

Data Analytics
Jul 01, 2024Learn practical methods for time series analysis for SMEs, including moving averages, exponential smoothing, ARIMA models, and seasonal decomposition techniques.