
Data Analytics
9 Key Concepts to Know About Data Analytics: Essential Tips and Tricks
Jun 27, 2024
Did you know that 90% of the world’s data has been created in just the last two years? This surge in data is driving businesses to prefer data analytics more than ever before. Companies must sift through this vast amount of information to find actionable insights that can guide their strategies and keep them ahead of the competition.
Understanding data analytics allows organizations to transform raw data into meaningful decisions, improve efficiency, and drive innovation. For professionals, learning data analytics has become crucial not only to stay relevant in a data-driven world but also to improve career prospects and contribute significantly to their organizations' success.
Here are essential tips and tricks across ten key aspects of data analytics to help you fully utilize its potential and improve your business success.
Key Concepts and Tips in Data Analytics
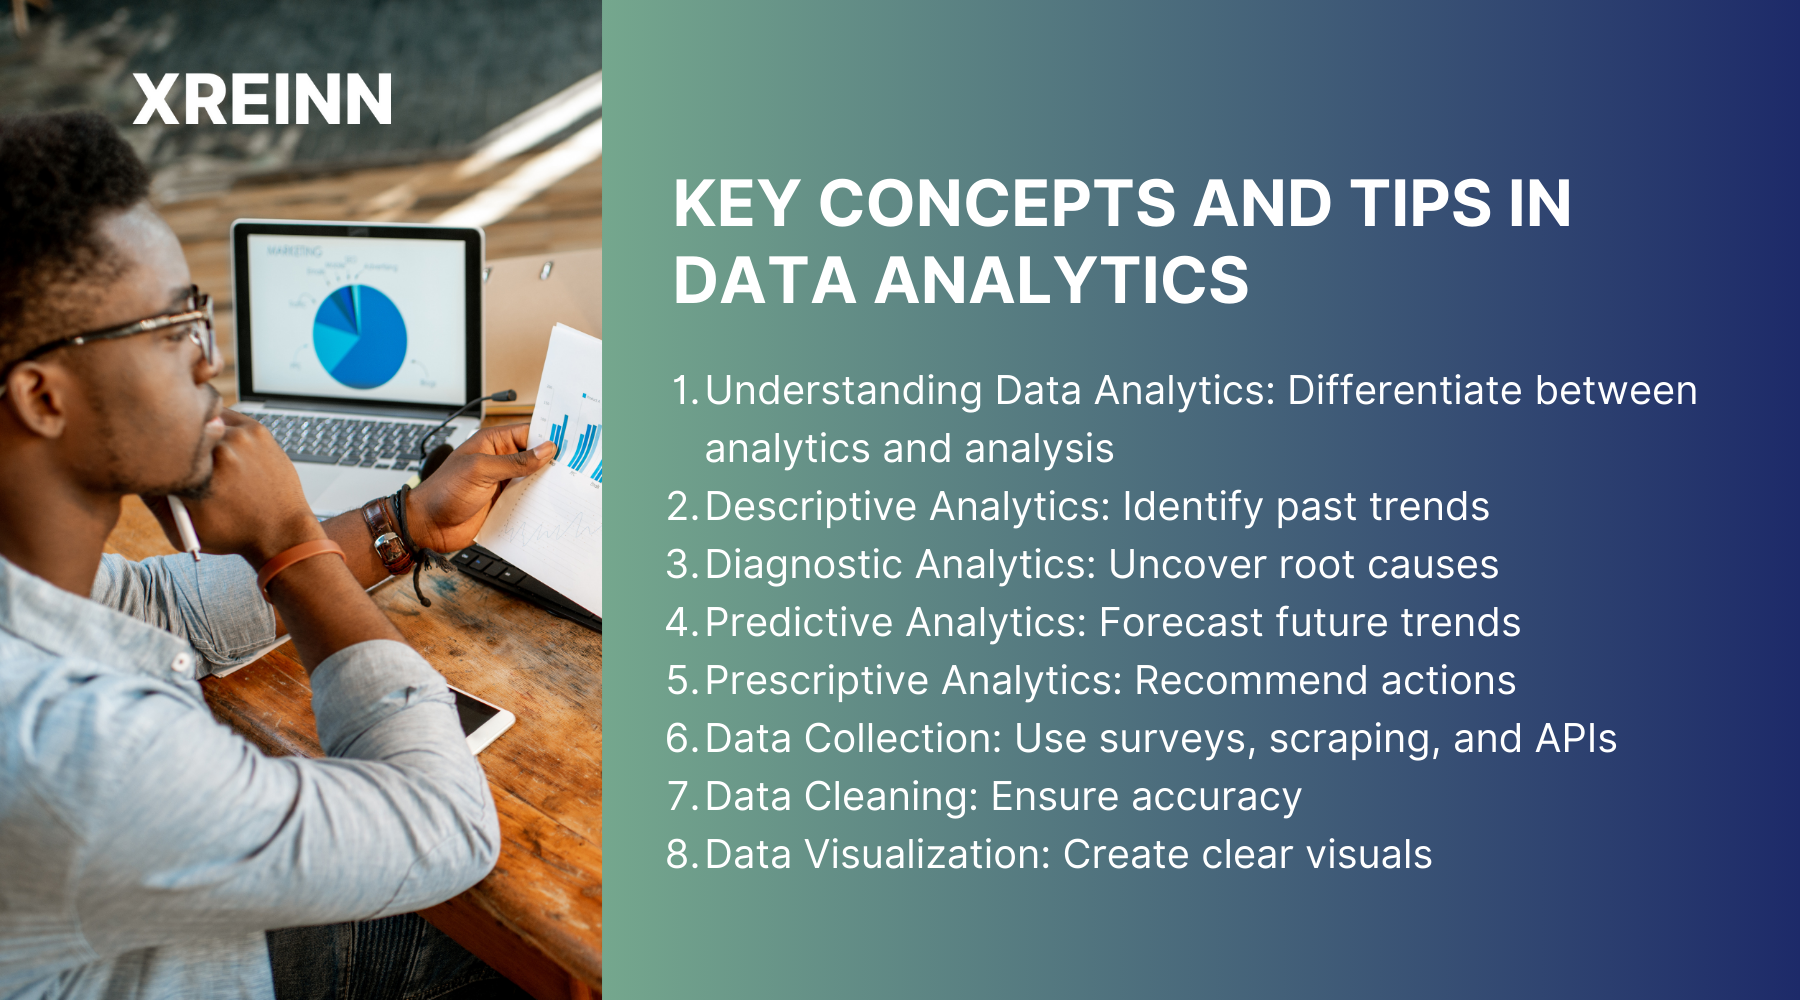
1. Understanding Data Analytics
Data analytics is the process of examining data sets to conclude the information they contain. This practice is used in various industries to help companies make better business decisions. It's important to distinguish between data analytics, data analysis, and data science.
While data analysis focuses on inspecting and modeling data, data science encompasses a broader scope, including machine learning and predictive modeling. Using data-driven decision-making, you can significantly improve operational efficiency and gain a competitive edge.
2. Types of Data Analytics
Descriptive Analytics
Descriptive analytics focuses on summarizing historical business data to provide insights into past performance. Analyzing data from sales, customer interactions, and operations, helps you understand what has occurred in your business.
Tools like Microsoft Excel and Google Analytics are often used to create reports and dashboards that highlight trends and patterns. This analysis is crucial for identifying strengths, weaknesses, and opportunities for improvement.
Diagnostic Analytics
Diagnostic analytics goes beyond simply describing past data; it aims to understand the reasons behind past performance. By examining relationships and patterns within the data, it helps identify the root causes of specific outcomes.
Techniques such as data mining, drill-down analysis, and correlation are used to uncover these insights. For example, if sales dropped in a particular quarter, diagnostic analytics can help pinpoint whether the cause was due to market changes, customer behavior, or internal issues.
Predictive Analytics
Predictive analytics uses historical data to make informed predictions about future business outcomes. By using statistical algorithms and machine learning models, it can forecast trends and behaviors, such as future sales, customer buying patterns, or market shifts.
Tools like Python libraries (e.g., Scikit-learn) and predictive models (e.g., regression analysis) are commonly used in this process. Predictive analytics helps businesses anticipate changes and make proactive decisions to optimize performance and strategy.
Prescriptive Analytics
Prescriptive analytics goes a step further by suggesting actions you can take to affect desired outcomes. It combines data, mathematical models, and algorithms to determine the best course of action.
Optimization techniques and decision analysis are integral to prescriptive analytics. This type of analytics helps you identify not just what will happen, but also what you should do about it.
3. Data Collection Methods
Effective data analytics starts with reliable data collection. There are several methods to gather data, each with its advantages.
Surveys and Questionnaires
Surveys and questionnaires are traditional but effective methods for collecting data directly from your audience. They can be used to gather specific information and insights.
Web Scraping
Web scraping involves extracting data from websites. This method is useful for gathering large volumes of data from public sources. However, it's important to adhere to legal and ethical guidelines while scraping data.
Data from APIs
APIs (Application Programming Interfaces) allow you to access data from different software applications. They are highly efficient for automated data collection and integration. Always ensure that the data obtained via APIs is accurate and relevant to your needs.
Maintaining high data quality is important. To ensure this, always verify the accuracy and consistency of your data. Use techniques such as data validation and regular audits to maintain data integrity.
4. Data Cleaning and Preparation
Before analyzing data, it must be cleaned and prepared. Data cleaning involves removing errors and inconsistencies, and ensuring the dataset is accurate and reliable.
Importance of Data Cleaning
Clean data is essential for accurate analysis. Inaccurate or inconsistent data can lead to misleading conclusions, so it's important to address any issues before proceeding with analysis.
Common Data Cleaning Techniques
Handling missing values: Decide whether to remove, replace, or fill in missing data based on its impact on your analysis.
Removing duplicates: Duplicate entries can skew results, so ensure each data point is unique. Standardizing data: Ensure consistency in data formats, such as dates and units of measurement.
Tools for Data Cleaning
Several tools can assist in data cleaning, including OpenRefine and Trifacta. These tools offer features to automate and streamline the data-cleaning process, making it more efficient.
5. Data Visualization
Visualizing data helps transform complex data sets into understandable information. It allows you to identify patterns, trends, and outliers quickly.
Importance of Data Visualization
Data visualization is crucial for communicating insights effectively. It turns data into a visual context, making it easier for stakeholders to understand and act upon the findings.
Common Data Visualization Tools
Tools like Tableau, Power BI, and D3.js are popular for creating visual representations of data. They offer a range of features to customize and enhance your visualizations.
6. Statistical Analysis
Statistical analysis is the backbone of data analytics. It involves collecting and scrutinizing data samples to uncover patterns and trends.
Understanding basic statistical concepts like mean, median, mode, and standard deviation is essential. These metrics provide an understanding of the central tendency and variability of your data.
Importance of Hypothesis Testing
Hypothesis testing allows you to make inferences about a population based on sample data. It's an important step in validating your findings and ensuring they are statistically significant.
Commonly Used Statistical Tests
Different statistical tests serve different purposes. For instance, T-tests compare means between two groups. Chi-square tests assess relationships between categorical variables.
ANOVA compares means among three or more groups. Learning these tests enables you to perform good statistical analyses and derive meaningful information.
7. Machine Learning in Data Analytics
Machine learning (ML) improves data analytics by automating the process of learning from data and making predictions. This involves training algorithms to recognize patterns in data and make predictions or decisions without explicit programming. Understanding these key algorithms is important for effective ML implementation:
Linear regression predicts continuous outcomes based on input variables. Decision trees split data into branches to make predictions based on feature values. Grouping similar data points is useful for segmenting data.
Tips for Implementing Machine Learning Models
Start with clean, well-prepared data to ensure accurate results. Choose the right algorithm for your specific problem. Improve your model performance using metrics like accuracy, precision, and recall. Continuously refine and update your models as new data becomes available.
8. Big Data Technologies
Big data technologies enable you to handle and analyze vast amounts of data efficiently. Big data refers to data sets that are too large or complex for traditional data-processing software. It requires specialized technologies to store, process, and analyze.
Several technologies are pivotal in big data analytics. Hadoop is a framework that allows for distributed processing of large data sets. Spark: An engine for big data processing with in-memory computation capabilities. NoSQL databases: Designed to handle unstructured data and scale horizontally.
Tips for Managing and Analyzing Big Data
Clean and validate data before analysis. Use scalable tools that can handle large data volumes efficiently. Also, regularly monitor and optimize the performance of your big data solutions.
9. Data Privacy and Ethics
As you work with data, you must consider privacy and ethical implications. Respecting data privacy and adhering to ethical standards protect both individuals and organizations. You must remember, that mishandling data can lead to legal consequences and damage to reputation.
Key Regulations
Familiarize yourself with major data privacy regulations such as GDPR (General Data Protection Regulation) that govern data protection in the European Union. Also, the CCPA (California Consumer Privacy Act) provides data privacy rights to residents of California, which you must consider.
Obtain explicit consent from individuals before collecting their data - Anonymize data to protect personal information. Implement powerful security measures to prevent data breaches. Be transparent about how you collect, use, and store data.
Conclusion
Understanding these key concepts in data analytics equips you with the tools to make well-informed decisions and improve your outcomes. The domain of data analytics is complex and evolving each day which requires continuous learning and adaptation.
Integrating these principles into your practice will significantly improve your analytical skills and support your professional growth. Use these concepts in your work and witness the positive impact that a data-driven approach can bring to your projects and career.
Data Analytics
Jun 27, 2024Master key concepts in data analytics with practical tips to enhance decision-making and achieve success in your projects and professional growth

Data Analytics
Jul 01, 2024Learn the essential stages of the data analytics workflow to turn your data into valuable business insights and drive growth.

Data Analytics
Jul 01, 2024Learn practical methods for time series analysis for SMEs, including moving averages, exponential smoothing, ARIMA models, and seasonal decomposition techniques.