
Data Analytics
5 Key Stages of the Data Analytics Workflow
Jul 01, 2024
Your business is filling up with data, but how do you transform it into valuable insights? Data analytics is the answer, and understanding its workflow is very important. Imagine pinpointing exactly what drives your sales, predicting future trends, and making the best decisions that push your business forward. Understanding the stages of data analytics will enable you with the tools to use data for strategic growth and competitive advantage.
Whether you're managing a small or medium-sized enterprise, this guide will give you the five key stages of the data analytics workflow with a step-by-step approach to using data effectively.
Data Analytics Workflow Stages
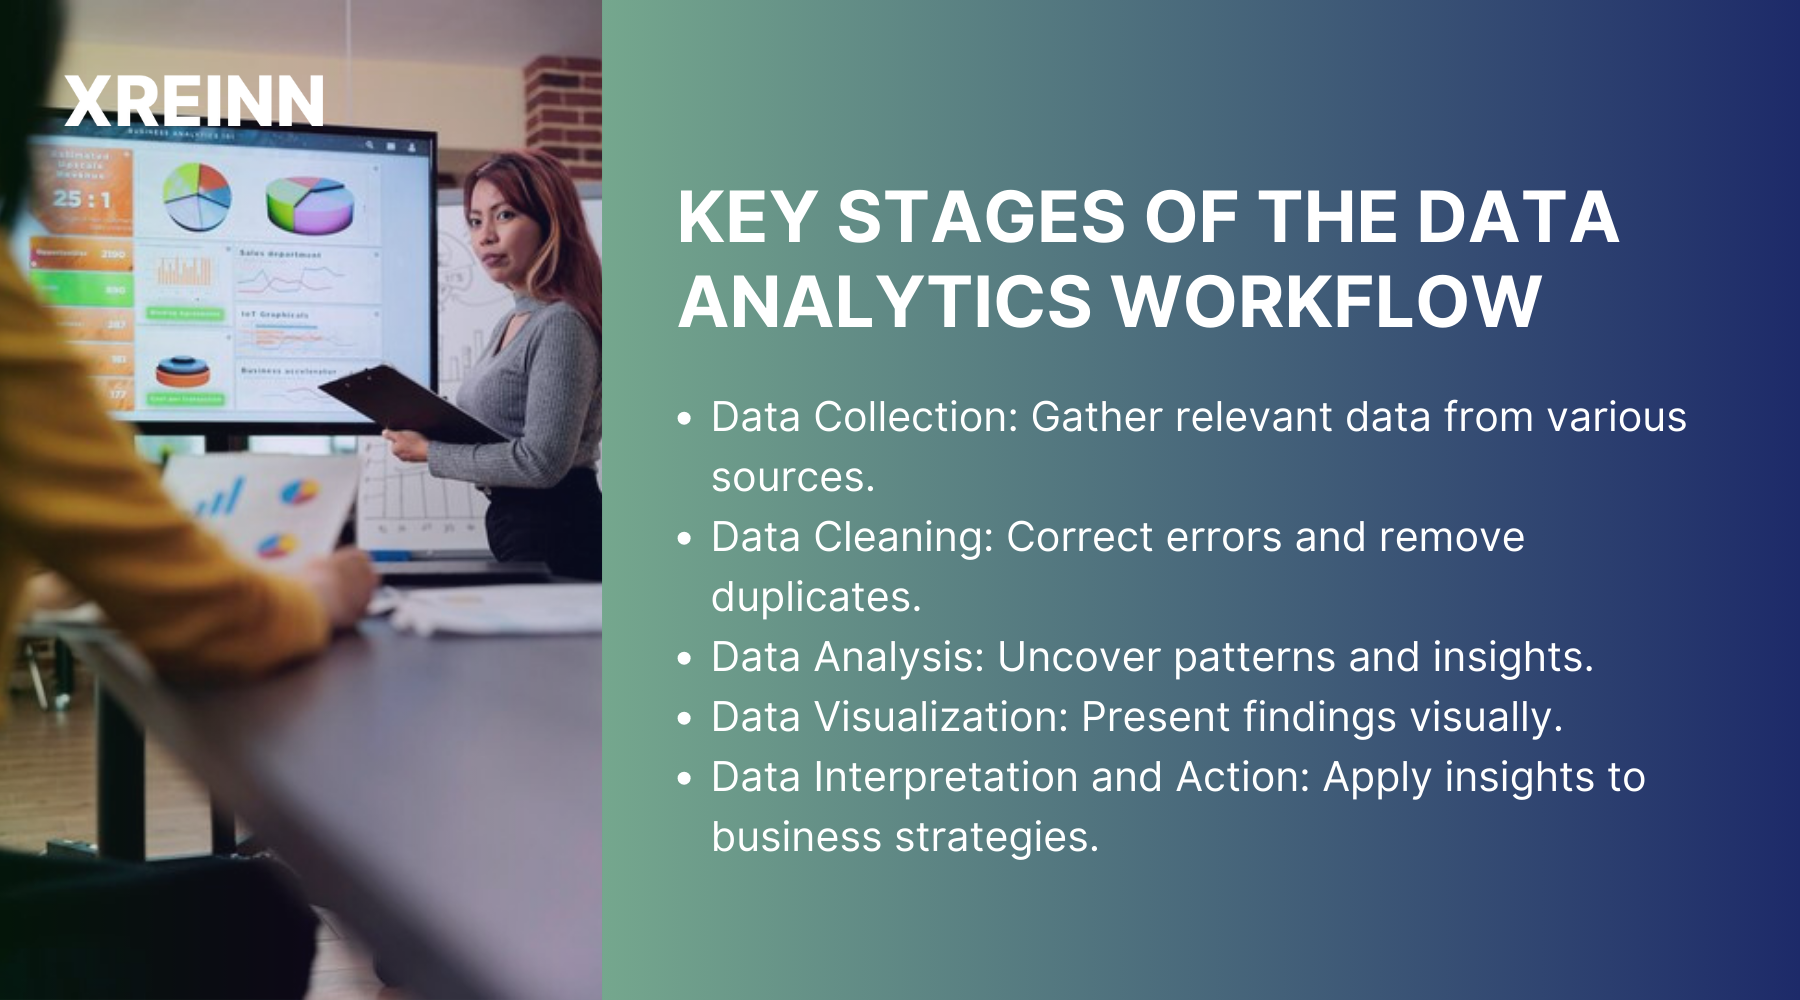
Stage 1: Data Collection
Data collection is the foundation of any data analytics project. It involves gathering information from various sources to get a comprehensive view of your business environment. You might collect data from surveys, social media, web scraping, or transactional records. The goal is to gather accurate and relevant data that reflects your business operations and customer behaviors.
To collect high-quality data, use reliable tools and techniques. For example, surveys can provide direct insights from customers, while web scraping can help you understand market trends. Social listening tools like Hootsuite or Brandwatch can track what people are saying about your brand online. Always ensure the data you collect is relevant to your objectives and is obtained ethically.
Best Practices for Data Collection
Best practices for data collection involve several key steps to ensure the data's relevance and reliability. First, it's crucial to define clear objectives, knowing precisely what you aim to achieve with the data. This direction guides the entire collection process. Using reliable sources is equally important, as credible data sources improve the validity of your findings.
Maintaining data quality is another critical aspect; regularly checking for errors or inconsistencies ensures the integrity of your data. Lastly, always consider ethical considerations by respecting privacy laws and regulations, which protect individuals' rights and build trust in your data practices.
Stage 2: Data Cleaning
Once you've collected your data, the next step is to clean it. Data cleaning involves correcting errors, removing duplicates, and dealing with missing values. This stage is important because even the best analysis cannot compensate for poor-quality data.
Common issues you might encounter include typos, inconsistent formats, and missing entries. Addressing these issues ensures that your data is accurate and reliable. Tools like OpenRefine or Excel can help streamline this process, making it easier to spot and fix problems.
Techniques for Data Cleaning
Data cleaning involves several techniques to ensure high-quality data. Data imputation fills in missing values using statistical methods, while normalization ensures that data is in a consistent format.
Deduplication removes duplicate entries to prevent skewed results, and validation involves cross-checking data against other sources to verify its accuracy.
Stage 3: Data Analysis
With clean data in hand, you're ready for the data analysis. This stage involves examining your data to uncover patterns, trends, and insights. There are several types of data analysis, each serving a different purpose:
1. Descriptive Analysis: Summarizes data to understand what has happened.
2. Diagnostic Analysis: Investigates the reasons behind past outcomes.
3. Predictive Analysis: Uses historical data to forecast future events.
4. Prescriptive Analysis: Provides recommendations based on data insights.
Choosing the right type of analysis depends on your business questions. For instance, if you want to understand customer behavior, descriptive and diagnostic analyses can be very useful. On the other hand, predictive analysis can help you anticipate future trends and prepare accordingly.
Methods and Techniques
Statistical analysis employs statistical methods to analyze data, while machine learning uses algorithms to identify patterns and make predictions. Data mining extracts useful information from large datasets, uncovering valuable insights hidden within the data.
Stage 4: Data Visualization
Data visualization is about presenting your analysis in a way that is easy to understand and interpret. Good visualizations can transform complex data into clear and compelling stories. Common types of visualizations include charts, graphs, and dashboards.
Tools like Tableau and Power BI are excellent for creating impactful visualizations. They allow you to present data in various formats, making it easier for stakeholders to grasp the insights. Effective visualizations highlight key findings and support data-based decision-making.
Tips for Effective Visualizations
When creating data visualizations, it's important to choose the type that best represents your data to ensure clarity. Keep your visuals simple and focused on the main message to avoid confusion. Use colors thoughtfully to highlight key points, and add interactive elements to allow viewers to explore the data in more depth.
Stage 5: Data Interpretation and Action
The final stage is interpreting the data and taking action. This involves understanding what your analysis and visualizations mean for your business. It's important to align these insights with your business goals and strategies.
To interpret data effectively, consider the context and implications of your findings. For instance, if your analysis shows a decline in customer satisfaction, investigate the underlying causes and develop a plan to address them. Data-oriented decisions can lead to improved performance, increased customer satisfaction, and better business outcomes.
Strategies for Implementation
To make the most of your data, first, ensure that your insights align with your business goals. Then, create detailed action plans based on these insights to implement targeted improvements. Finally, regularly monitor the outcomes of your actions and adjust as needed to stay on course and achieve the best results.
Common Challenges in the Data Analytics Workflow and How to Overcome Them
While learning the data analytics workflow can significantly benefit your business, it's not without its challenges. Understanding these challenges and knowing how to address them can help you see the process more smoothly.
Data Collection Challenges
Data overload is a common issue, as collecting too much data can affect your system and complicate analysis. To avoid this, focus on collecting relevant data that lines up with your objectives. Additionally, data privacy issues can complicate the process, so always prefer ethical data collection practices and transparency to ensure compliance with regulations like GDPR.
Data Analysis Challenges
Lack of expertise is a significant hurdle in data analysis, as it requires specialized skills in statistics and data science. Consider hiring experts or training your team to build these capabilities. Choosing the right analysis techniques can also be challenging with so many options available. Start with clear business questions and select methods that best address them.
Data Visualization Challenges
Overcomplicated visuals can confuse rather than clarify your data's message. Focus on simplicity and clarity to ensure your audience understands the insights. Tool limitations can also hinder effective visualization, so choose tools that offer the flexibility and features you need to present your data effectively.
Data Interpretation Challenges
Misinterpreting data without proper context is a common issue. Always consider the broader business environment and seek multiple perspectives when interpreting data. Implementing insights into action requires strategic planning and organizational buy-in. Enabling a data-driven culture within your organization ensures successful implementation.
Conclusion
Understanding the data analytics workflow is essential for any business looking to grow in the digital age. By learning these five stages—data collection, data cleaning, data analysis, data visualization, and data interpretation—you can convert raw data into valuable information that enables you to make the best decisions.
For SMEs, this knowledge is more than important. It enables you to compete with larger organizations by making data-oriented decisions that improve efficiency, customer satisfaction, and growth. So, leap into your data, follow these stages, and watch your business rise in the growing digital market.

Data Analytics
Jun 27, 2024Master key concepts in data analytics with practical tips to enhance decision-making and achieve success in your projects and professional growth
Data Analytics
Jul 01, 2024Learn the essential stages of the data analytics workflow to turn your data into valuable business insights and drive growth.

Data Analytics
Jul 01, 2024Learn practical methods for time series analysis for SMEs, including moving averages, exponential smoothing, ARIMA models, and seasonal decomposition techniques.