
Data Analytics
Unlocking Python for Data Analytics: A Step-by-Step Guide for Beginners
Jul 06, 2024
In an era where data drives decision-making, learning how to use the capability of data can set you apart in your career or business. Imagine being able to predict customer behavior, optimize operations, and uncover trends before they become mainstream. Python, a distinct and user-friendly programming language, can help you achieve this and more.
This guide is designed to take you through the essentials of using Python for data analytics, even if you're a beginner. Let's see how Python can convert your data into actionable values.
Why Choose Python for Data Analytics?
Choosing the right tool for data analytics is important. Python stands out due to its accessibility and ease of learning. It's simple and readable syntax makes it an excellent choice for beginners. Unlike other programming languages that require extensive training, Python allows you to start analyzing data quickly.
Python's versatility is another key benefit. Not only is it great for data analytics, but it can also be used for web development, automation, and more. This means you can integrate your data analytics workflows seamlessly with other projects. Additionally, Python's strong community support provides extensive resources, including tutorials, documentation, and forums, ensuring you never feel stuck for long.
Finally, Python's scalability allows it to handle both small datasets and big data efficiently. As your skills and data grow, Python grows with you, maintaining performance without compromise.
Getting Started with Python
To begin your journey with Python, start by installing the necessary tools. Anaconda is a popular distribution that simplifies package management and deployment. It comes with Jupyter Notebook, a powerful tool for interactive data analysis.
Once you have Python installed, familiarize yourself with its basic syntax and concepts. Practice writing simple scripts and get comfortable with the environment. Setting up your workspace properly ensures a smooth transition into more complex tasks.
Essential Python Libraries for Data Analytics
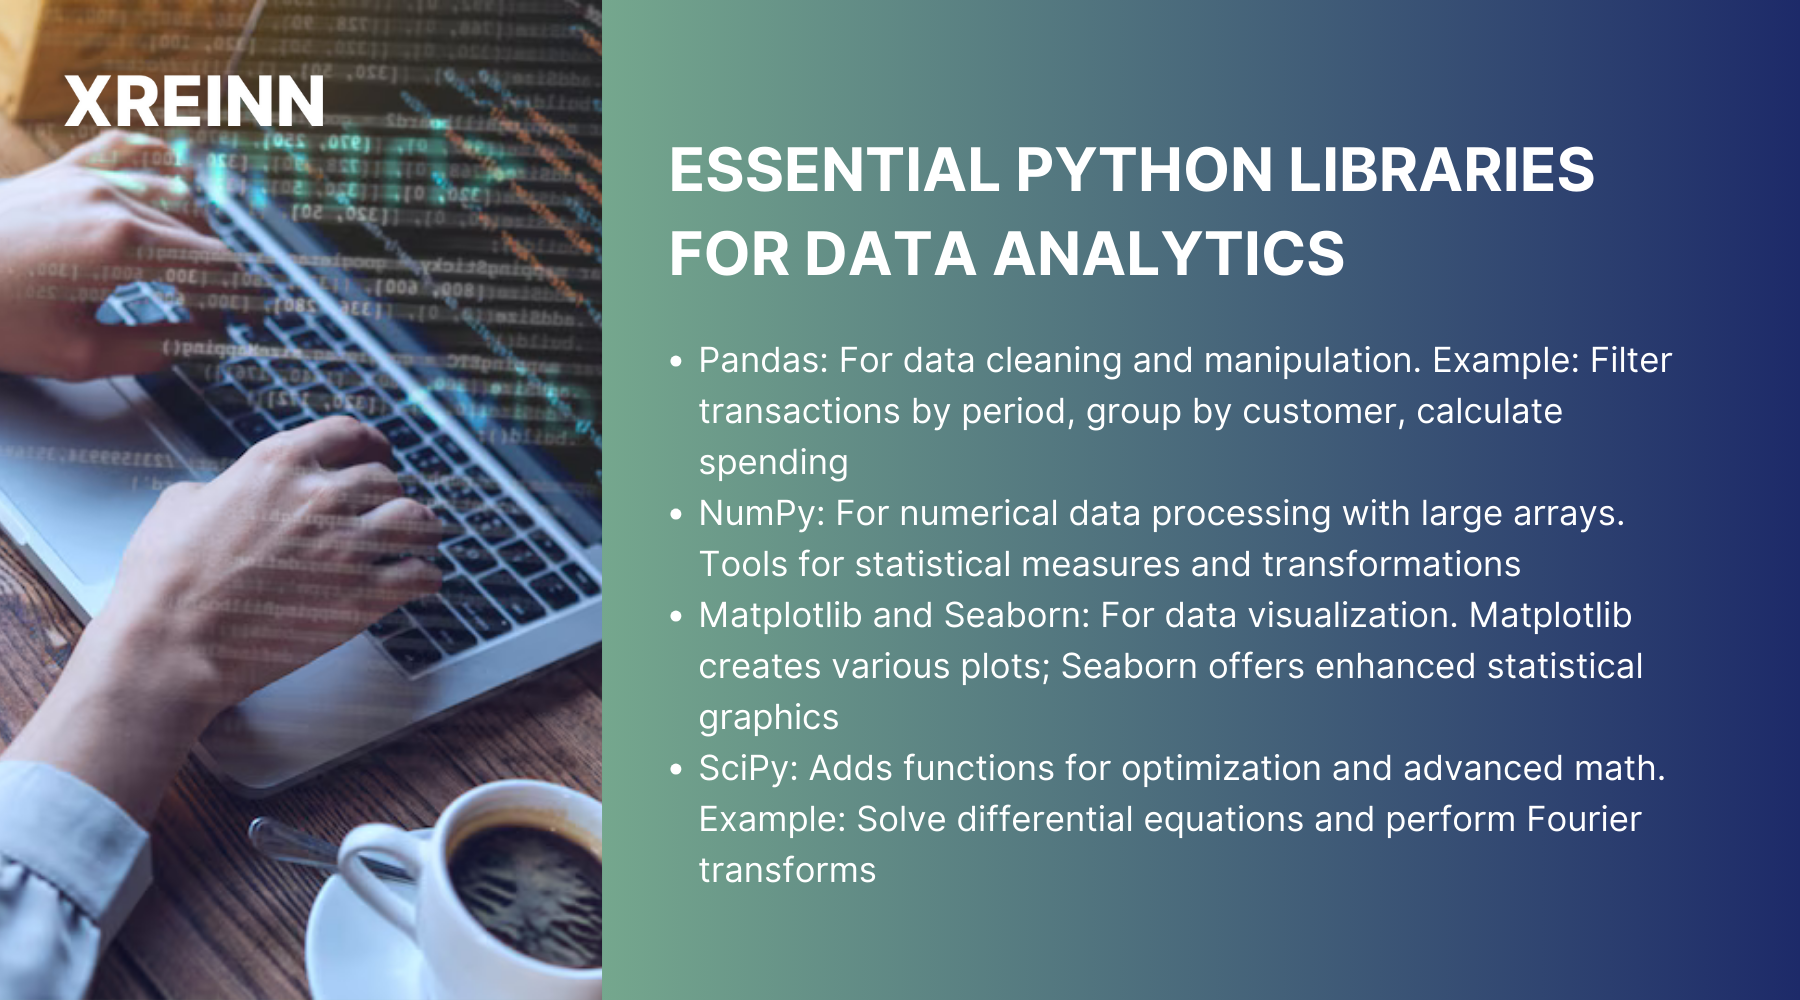
To make the most of Python for data analytics, you need to familiarize yourself with its essential libraries. These libraries provide powerful tools for data manipulation, visualization, and analysis.
1. Pandas
Pandas is the cornerstone of data analysis in Python. It offers data structures like DataFrames, which are perfect for working with structured data. With Pandas, you can easily clean, manipulate, and analyze data.
For example: Imagine you have a dataset of customer transactions. Using Pandas, you can filter transactions to show only those that occurred in the last month, group the transactions by customer, and then calculate the total spending for each customer. This allows you to identify your top spenders and understand their buying behavior.
2. NumPy
NumPy is important for numerical data processing. It supports large, multi-dimensional arrays and matrices, along with a collection of mathematical functions to operate on these arrays.
For instance, suppose you have a dataset of daily temperatures over several years. You can use NumPy to calculate the average temperature for each year, identify the hottest and coldest days, and perform statistical analysis to understand temperature trends over time.
3. Matplotlib and Seaborn
Data visualization is a vital part of data analytics. Matplotlib is a distinct plotting library that allows you to create a variety of visualizations, including line plots, bar charts, histograms, and scatter plots. Seaborn builds on Matplotlib and provides a high-level interface for drawing attractive and informative statistical graphics.
For example, If you want to visualize the distribution of sales data, you can use Matplotlib to create a histogram that shows the frequency of different sales amounts. Seaborn can improve this visualization by adding kernel density estimates, making it easier to understand the distribution's shape.
4. SciPy
SciPy is used for scientific and technical computing. It builds on NumPy and offers additional functionality for optimization, integration, and other advanced mathematical operations.
For instance, if you need to optimize a supply chain, SciPy can help you solve complex problems such as minimizing transportation costs or maximizing production efficiency. It provides tools for linear programming and other optimization techniques.
Data Manipulation with Python
With the right tools in hand, mastering data manipulation is the next step. This involves cleaning, transforming, and aggregating data to prepare it for analysis.
1. Data Cleaning
Data cleaning is the process of identifying and correcting errors and inconsistencies in your dataset. Accurate data is important for reliable analysis. Using Pandas, you can handle missing values, remove duplicates, and correct data types.
If your dataset includes missing customer ages, you can use Pandas to fill these gaps with the average age. Additionally, if there are duplicate transaction records, you can easily remove them to ensure your analysis is based on accurate data.
2. Data Transformation
Data transformation changes the format or structure of your data, making it suitable for analysis. This can include normalizing values, encoding categorical variables, and creating new features.
Suppose you have a dataset with customer purchase data, including categorical variables like product categories. You can use Pandas to convert these categories into numerical codes and create new features, such as total spending per customer or the number of purchases in each category.
3. Data Aggregation
Data aggregation summarizes data by grouping and applying aggregate functions. This step is essential for gaining high-level insights. Pandas offers powerful tools for data aggregation.
If you want to analyze monthly sales performance, you can group your sales data by month and calculate the total sales for each month. This helps you identify seasonal trends and make informed business decisions.
Data Visualization Techniques
Visualizing data helps you make sense of complex datasets. It allows you to see relationships and patterns, making it easier to explain your findings.
1. Creating Effective Visualizations
Choosing the right type of chart or graph is crucial. Matplotlib lets you create a variety of static, animated, and interactive plots. For instance, a line plot can show sales trends over time, while a bar chart can compare sales across product categories. Seaborn, with its high-level interface, allows you to create more sophisticated visualizations, such as scatter plots and heatmaps.
If you want to understand the relationship between customer age and spending, you can use Seaborn to create a scatter plot that visually represents this relationship, making it easier to spot trends or outliers.
2. Advanced Visualization Techniques
For more sophisticated visualizations, libraries like Plotly and GeoPandas are invaluable. Plotly allows you to create interactive visualizations, such as dashboards, enabling users to explore different aspects of your data. GeoPandas is excellent for geographic data visualization, allowing you to create maps showing customer distribution by region.
If your business operates in multiple regions, GeoPandas can help you create a map that shows sales distribution geographically. This can be crucial for making location-based marketing decisions.
Machine Learning with Python
Machine learning involves using algorithms to find patterns in data and make predictions. Python's extensive libraries make it easy to implement machine learning models.
Key Python Libraries for Machine Learning
Python offers several libraries for machine learning, including Scikit-learn, TensorFlow, and Keras. Scikit-learn is user-friendly and provides a wide range of algorithms for classification, regression, clustering, and more. TensorFlow and Keras are powerful for building deep learning models.
Scikit-learn can be used to build a model that predicts customer churn based on historical data. This helps businesses identify at-risk customers and take proactive measures to retain them.
Implementing Machine Learning Models
Building a machine learning model involves data preparation, model selection, training, evaluation, and deployment. Scikit-learn simplifies these steps.
You can use Scikit-learn to train a model on past sales data to forecast future sales. By evaluating the model's accuracy, you can make more informed inventory and marketing decisions.
Evaluating Model Performance
Evaluating the performance of your models ensures their accuracy and reliability. Python provides tools for model evaluation, such as cross-validation, confusion matrices, and ROC curves.
When building a classification model to predict customer churn, you can use a confusion matrix to understand the model's accuracy, precision, and recall. This ensures your predictions are reliable.
Conclusion
Learning Python for data analytics opens up a world of opportunities. Its simplicity, supportive community, and scalability make it an excellent choice. By understanding essential libraries like Pandas, NumPy, Matplotlib, and Scikit-learn, you can tackle complex data analysis tasks efficiently. Effective data manipulation and visualization techniques will help you uncover deep insights and communicate your findings. Use Python for your data analytics needs and watch as you transform raw data into valuable information, driving smarter decisions and fostering growth.

Data Analytics
Jun 27, 2024Master key concepts in data analytics with practical tips to enhance decision-making and achieve success in your projects and professional growth

Data Analytics
Jul 01, 2024Learn the essential stages of the data analytics workflow to turn your data into valuable business insights and drive growth.

Data Analytics
Jul 01, 2024Learn practical methods for time series analysis for SMEs, including moving averages, exponential smoothing, ARIMA models, and seasonal decomposition techniques.