
Research
How to Analyze Data in 5 Steps for Better Business Decisions
Aug 09, 2024
A company’s success often comes down to how well it can turn raw data into useful insights. This transformation requires a structured and systematic approach to data analysis. With the vast amounts of data available at your fingertips, knowing how to sift through it and extract meaningful insights can mean the difference between success and failure.
That's why a structured approach to data analysis is important for business leaders who want to stay ahead. Following a clear, step-by-step process ensures that your analysis is comprehensive, accurate, and aligned with your business objectives.
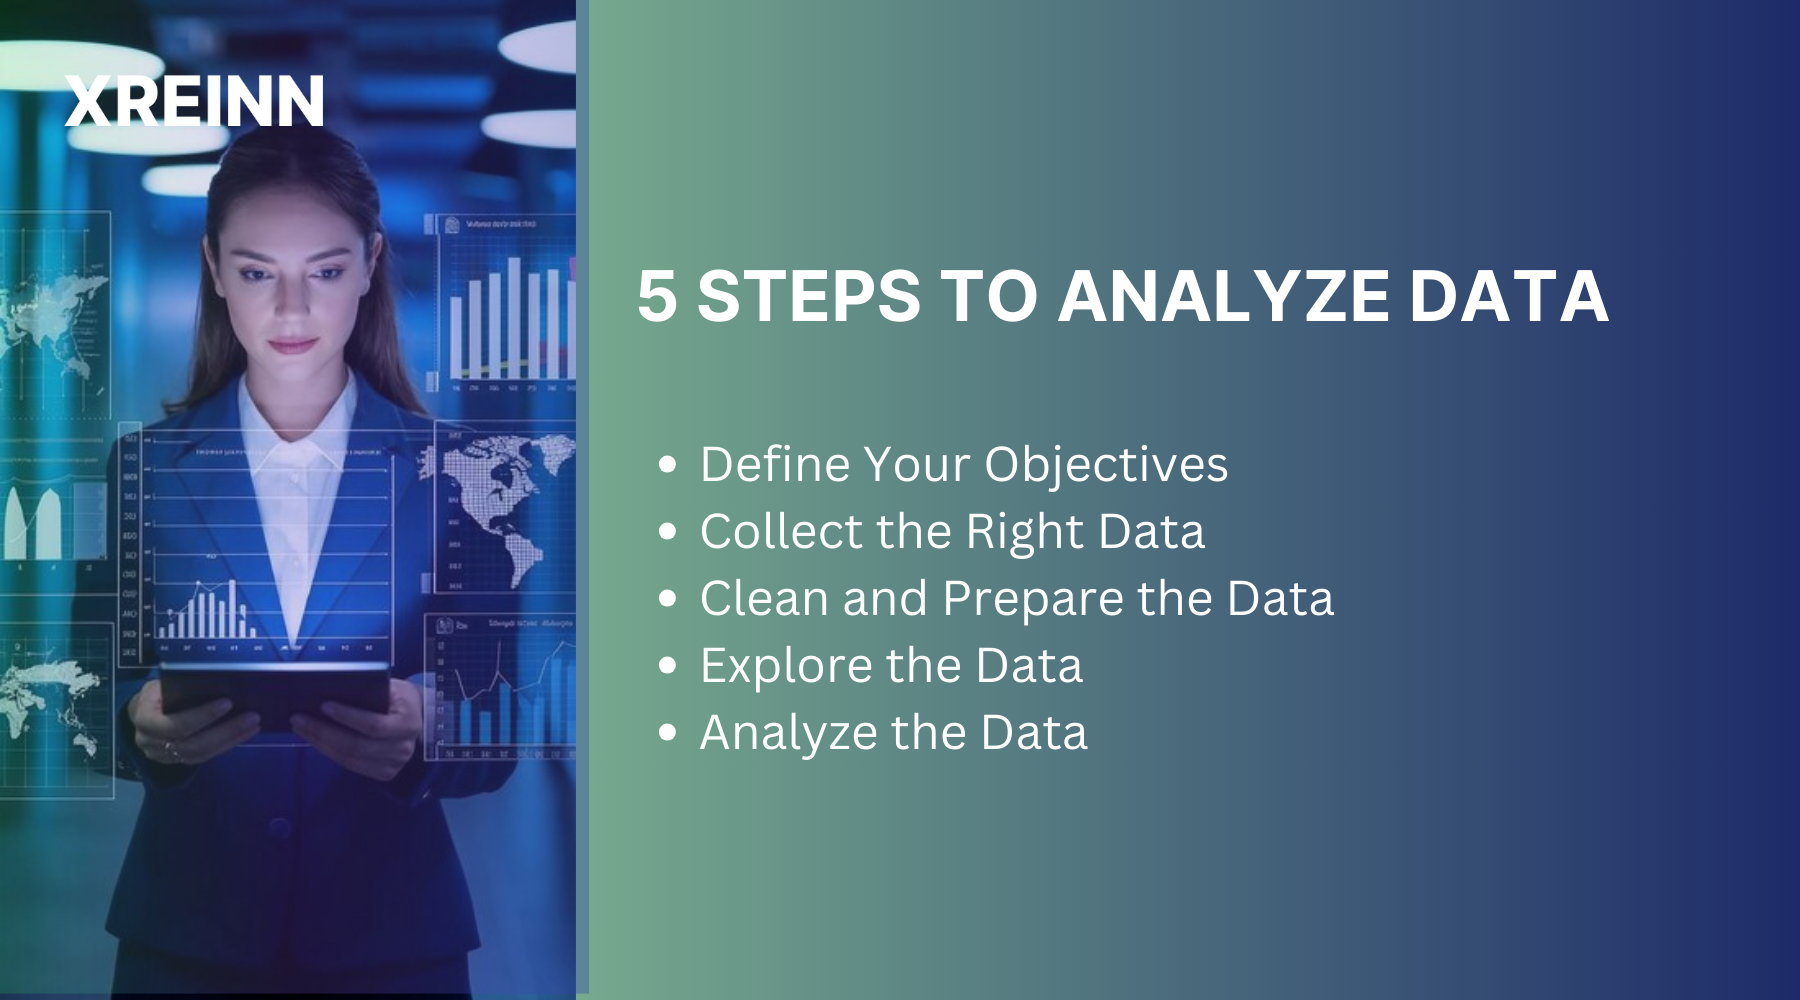
These five steps will guide you from defining your goals to making the best-informed decisions, helping you avoid common pitfalls and showing the true potential of your data.
Importance of Analyzing Data
Analyzing data is important for any business aiming to succeed in the current competitive setting. It's not just about understanding past performance; it's about shaping future strategies. Effective data analysis helps identify growth opportunities, improve customer satisfaction, and streamline operations. By examining patterns and trends, businesses can customize their marketing strategies, optimize pricing, and improve efficiency.
Data analysis also provides the foundation for strategic decision-making, allowing companies to predict market trends, reduce risks, and drive innovation. It enables businesses to make evidence-based decisions, leading to more predictable and favorable outcomes. In essence, data analysis bridges the gap between raw information and actionable insights. Businesses that adopt data analysis as a core component of their strategy are better positioned to succeed in a rapidly changing market.
5 Steps to Analyze Data
Here are the steps to analyze data effectively.
1. Define Your Objectives
Before starting into data analysis, it's important to define your objectives clearly. You need a clear understanding of what you want to achieve. Without a well-defined goal, your analysis can become unfocused and ineffective. Start by identifying the specific business questions you want to answer. Are you looking to improve customer retention, optimize pricing strategies, or improve operational efficiency?
Whatever your goal, defining it at the outset will guide your analysis and ensure that your efforts align with your business strategy. This step requires you to dig deep and consider what insights will be most beneficial for your business.
How do you define your objectives effectively?
Identify the key business questions that need answering. These questions should align with your overall business strategy and address areas of concern or opportunity. Next, set measurable goals that provide a standard for evaluating the success of your analysis. These goals should be specific, achievable, and relevant to your business objectives.
Finally, focus on your objectives. While it's essential to have a plan, be open to adapting your objectives as you gain insights. Data analysis is a repetitive process, and new information may lead to a refinement of your goals.
2. Collect the Right Data
Once you have a clear objective, the next step is to collect the right data. You need to ensure that the data you gather is relevant, accurate, and comprehensive. Collecting the right data is a critical step in the data analysis process. To make informed decisions, you need data that is relevant, accurate, and comprehensive.
Identify the sources of data that align with your objectives. This could include internal data such as sales records, customer feedback, and website analytics, as well as external sources like market research reports and industry standards. Data quality is important, so ensure that your data is clean, consistent, and free from errors.
How do we collect the right data?
Start by identifying the sources that align with your objectives. Internal data sources might include sales records, customer feedback, and website analytics, while external sources could involve market research reports and industry standards. It's important to ensure that your data is clean, consistent, and free from errors. Regular data validation and cleansing processes help maintain data integrity.
Additionally, focus on collecting data that directly relates to your objectives, avoiding unnecessary information that could complicate your analysis. use data collection tools and technologies that automate the process, such as CRM systems, data analytics platforms, and web scraping tools. These technologies streamline data collection and improve efficiency.
3. Clean and Prepare the Data
Raw data often contains inconsistencies, missing values, and outliers that can skew your analysis. Data cleaning is a critical step in the data analysis process. Raw data is often messy, containing inconsistencies, missing values, and outliers that can skew your analysis. Therefore, data cleaning is important to ensure accurate results.
How to Clean Data?
Data cleaning involves several steps to ensure accuracy and consistency. You can start by identifying and removing duplicate entries that could inflate your data and lead to inaccurate analysis. Duplicates often occur during data collection and should be eliminated to ensure data accuracy.
Next, address missing values by imputing data, using statistical methods, or removing incomplete entries. The approach you choose depends on the significance of the missing data and its potential impact on your analysis. Detect and analyze outliers that deviate significantly from the rest of the data. Outliers may indicate errors or unique trends that warrant further investigation.
Finally, ensure that your data follows consistent formats, such as date formats, currency symbols, and units of measurement. Consistent formatting prevents confusion and facilitates accurate analysis. Normalizing numerical data eliminates bias and ensures that all variables contribute equally to the analysis. Normalization involves scaling data values to a common range, often between 0 and 1.
4. Explore the Data
Now that your data is clean, it's time to explore it. Exploratory data analysis (EDA) allows you to understand the data's underlying structure and discover patterns that might not be immediately obvious. Exploring your data is an essential step in the. By doing so, you can uncover patterns, trends, and insights that might not be immediately apparent. Exploring your data involves visualizing it and calculating descriptive statistics to gain insights into its structure and distribution.
How to Explore Data?
Exploratory Data Analysis (EDA) involves several techniques to gain insights into your data. Start by creating visualizations such as charts, graphs, and heatmaps to gain insights into data patterns. Visualizations make complex data more accessible and reveal trends that may not be evident from raw numbers. Calculate descriptive statistics such as mean, median, mode, and standard deviation to summarize the data's central tendencies and variability. These statistics provide a snapshot of the data's overall characteristics.
Explore correlations between variables to identify relationships and dependencies. Correlation analysis helps determine which factors are linked and may influence each other. Segment data into subsets based on specific criteria, such as customer demographics or product categories. Segmenting data allows you to analyze specific groups and uncover unique insights. Look for recurring patterns and trends within the data. Pattern recognition helps identify common behaviors, preferences, and anomalies that warrant further investigation.
5. Analyze the Data
Once you understand the data, it's time to analyze it. This step involves using various analytical techniques and tools to explore, visualize, and interpret the data, uncovering patterns, trends, and relationships that are not immediately apparent. Analyzing your data involves applying analytical techniques that align with your objectives and data type. Choose methods such as clustering, classification, ortime series analysis to extract insights. This step allows you to turn raw data into actionable insights that inform business decisions.
How to Analyze the Data?
To analyze your data effectively, choose the right analytical method that aligns with your objectives and data type. Common methods include regression analysis, clustering, classification, and time series analysis. Regression analysis helps identify relationships between variables and predicts future trends. It quantifies the impact of independent variables on dependent variables.
Moreover, cluster analysis groups data points with similar characteristics, revealing distinct segments within the data. This technique is useful for customer segmentation and market analysis. Classification analysis categorizes data into predefined groups based on specific attributes. It is often used for fraud detection, customer segmentation, and risk assessment. Time series analysis examines data over time to identify trends, and seasonal patterns, and forecast future values. This technique is valuable for sales forecasting and demand planning.
Conclusion
Analyzing data is important for making smart decisions. By following a structured five-step approach, you can transform raw data into valuable insights that help your business grow. This process helps you understand your business better, identify opportunities, and reduce risks. Remember that data analysis is a continuous process, and staying adaptable will keep you ahead of the competition. By making data analysis a part of your business strategy, you'll be better prepared to succeed in a changing market.

Data Analytics
Jun 27, 2024Master key concepts in data analytics with practical tips to enhance decision-making and achieve success in your projects and professional growth

Data Analytics
Jul 01, 2024Learn the essential stages of the data analytics workflow to turn your data into valuable business insights and drive growth.

Data Analytics
Jul 01, 2024Learn practical methods for time series analysis for SMEs, including moving averages, exponential smoothing, ARIMA models, and seasonal decomposition techniques.