
Data Analytics
Data Analysis in Research: Best Practices and Methods
Jul 02, 2024
As a business owner, understanding your data is important to making smart decisions and staying ahead of your competition. With the growing amount of data available, knowing how to analyze it effectively is more important than ever.
Your business strategies depend on choosing the right methods to examine this data. By following best practices in data analysis, you can convert raw information into useful knowledge that can drive your business forward.
This article will guide you through the best practices and methods for data analysis in research, giving you the tools you need to achieve accurate and impactful results.
Understanding Data Analysis in Research
Data analysis in research involves examining, cleaning, transforming, and modeling data to discover useful information, suggest conclusions, and support decision-making.
It plays an important role in deriving meaningful insights that can significantly influence academic, business, and scientific landscapes. Through careful data analysis, you as a researcher can validate your hypotheses, draw reliable conclusions, and contribute valuable knowledge to your field.
Types of Data Analysis
There are two types of data analysis: qualitative data analysis and quantitative data analysis. Which are;
1. Qualitative Data Analysis
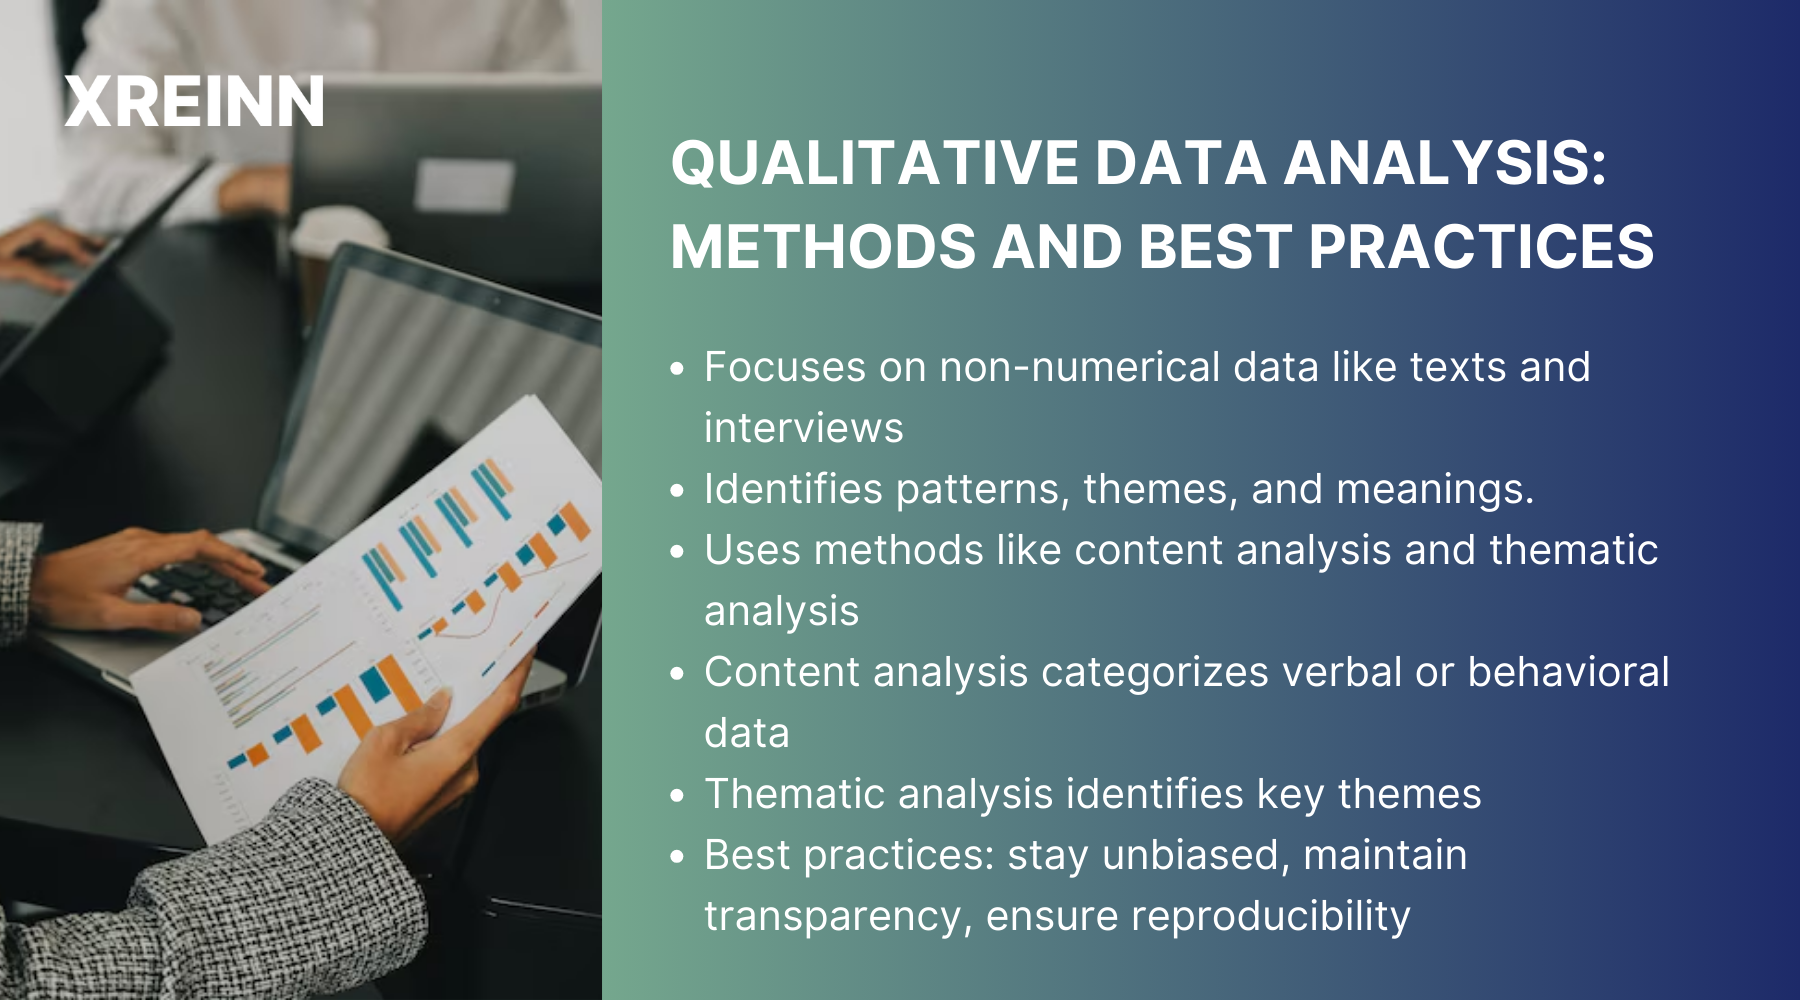
Qualitative data analysis focuses on non-numerical data like texts, interviews, and observations. It aims to identify patterns, themes, and meanings within this data. The process involves categorizing and interpreting data to understand underlying insights and contextual nuances.
Researchers use methods such as content analysis, thematic analysis, and narrative analysis. This approach helps to explore complex phenomena and provides an in-depth understanding of the subject matter.
Common Methods:
1. Content Analysis: This method systematically categorizes verbal or behavioral data to study communication patterns.
2. Thematic Analysis: This technique identifies and analyzes themes or patterns within qualitative data.
3. Narrative Analysis: This approach explores how stories and personal accounts shape the understanding of events.
4. Discourse Analysis: This method examines how language is used in texts and context.
Best practices for qualitative data analysis include staying unbiased, maintaining transparency, and ensuring the reproducibility of findings.
2. Quantitative Data Analysis
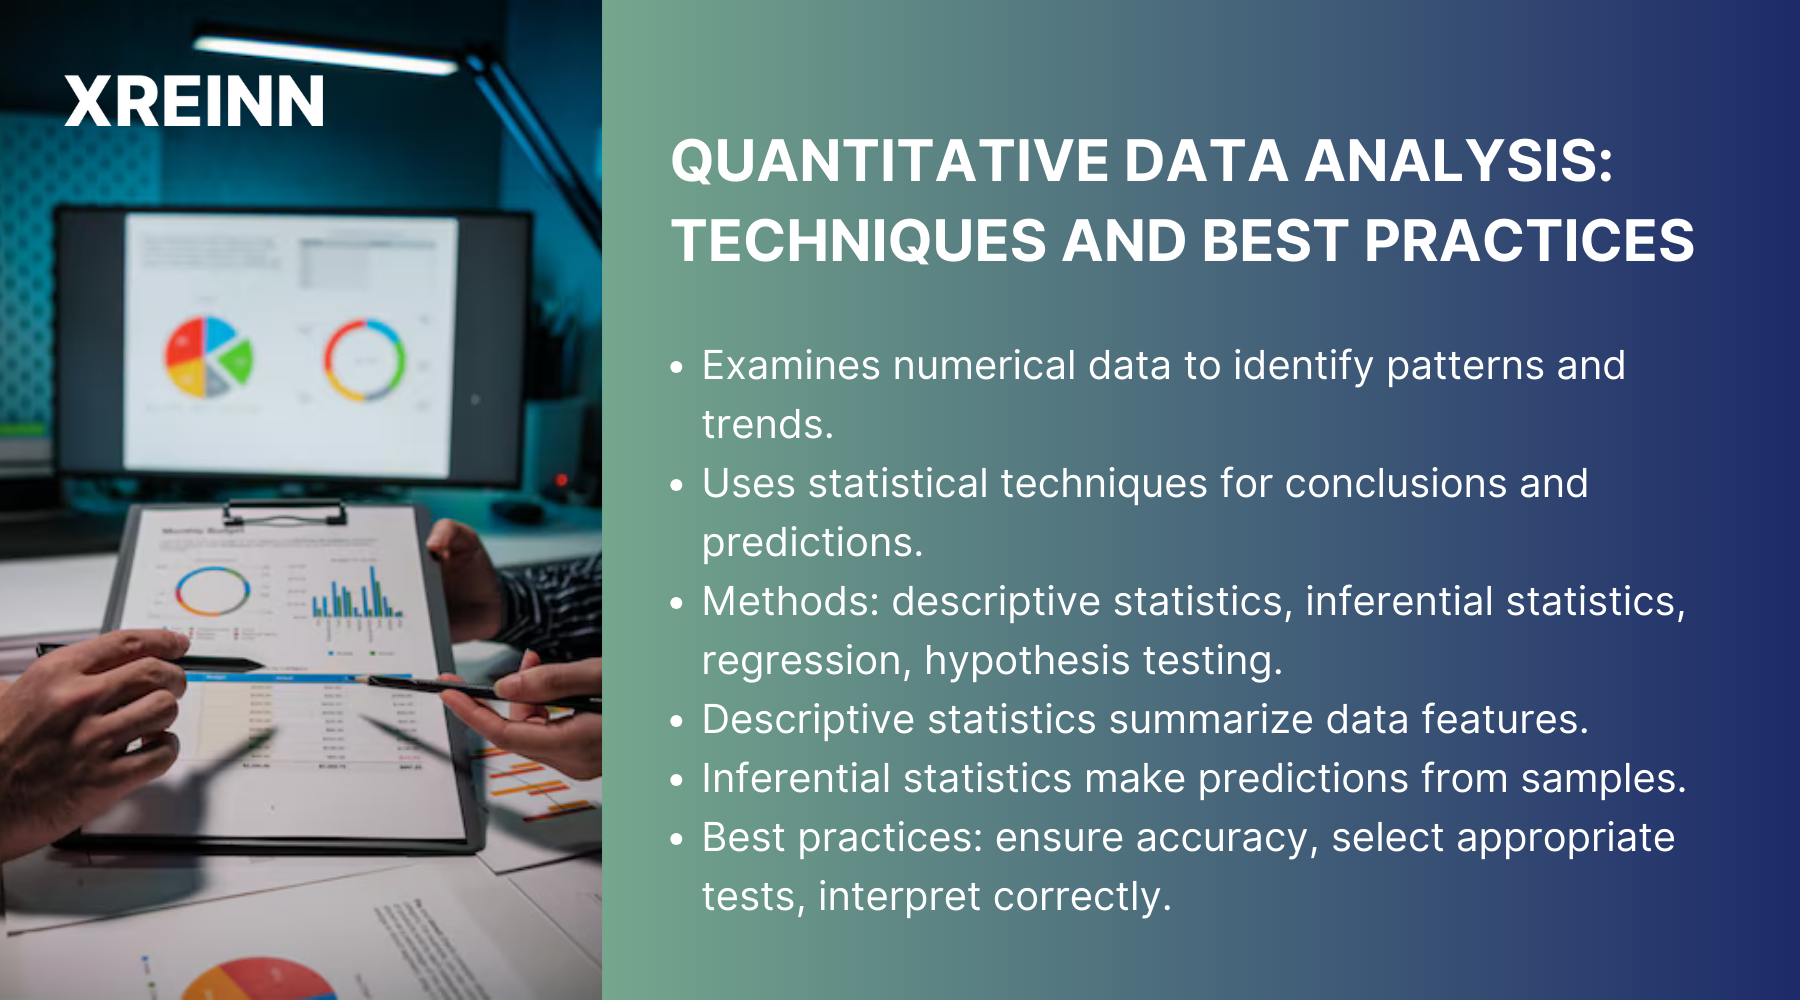
Quantitative data analysis involves examining numerical data to quantify variables and identify patterns, relationships, and trends. It employs statistical techniques such as descriptive statistics, inferential statistics, regression analysis, and hypothesis testing.
This approach allows researchers to draw objective conclusions and make predictions based on empirical data. By systematically analyzing numbers, quantitative data analysis provides a clear and measurable understanding of research questions.
Common Methods:
1. Descriptive Statistics: This summarizes and describes data features such as mean, median, and mode.
2. Inferential Statistics: This concludes and makes predictions based on sample data.
3. Regression Analysis: This assesses the relationship between dependent and independent variables.
4. Hypothesis Testing: This evaluates assumptions and determines statistical significance.
Best practices for quantitative data analysis involve ensuring data accuracy, selecting appropriate statistical tests, and interpreting results correctly.
Data Collection Techniques
There are two data collection techniques: primary data collection and secondary data collection. Here are the details;
1. Primary Data Collection
Primary data collection involves gathering new data directly from sources. This approach allows you to collect data that is specific and directly relevant to your research questions.
Surveys involve collecting data through questionnaires, which can be distributed online, via mail, or in person. They are useful for gathering large amounts of data quickly from a broad audience. However, designing the questionnaire carefully is important to avoid biases and ensure valid responses.
Interviews are conducted one-on-one or in groups to gather in-depth information. They allow you to gain insights into participants' thoughts, feelings, and behaviors. Interviews can be structured, semi-structured, or unstructured. While they provide rich, qualitative data, they can be time-consuming and may introduce interviewer bias.
Observations involve recording behaviors or events as they occur. This technique is particularly useful when understanding the context or environment is important. Observations can be overt or covert, depending on whether the subjects know they are being observed. While observations can provide valuable contextual data, they can be challenging to conduct without influencing the subjects' behavior.
Experiments involve manipulating one or more variables to observe the outcomes. This technique is fundamental in scientific research for establishing cause-and-effect relationships. Experiments can be conducted in controlled environments, like laboratories, or in natural settings. Although experiments offer high control over variables, they can be complex to design and execute, and ethical considerations must be managed carefully.
2. Secondary Data Collection
Secondary data collection utilizes existing data sources such as academic articles, government reports, and online databases. It can be beneficial due to the availability of large datasets and cost-effectiveness. However, researchers must critically evaluate the relevance and accuracy of secondary data to their specific study.
Data Management and Preparation
Effective data management is essential for maintaining research integrity. Properly storing, organizing, and securing your data ensures it remains accessible and reliable throughout the research process. Here's how to manage and prepare your data effectively:
Steps in Data Preparation:
1. Clean to remove errors or inconsistencies from the data, start by checking for and eliminating duplicate entries. Ensure all data fields are complete and accurate, and identify any outliers that could distort your analysis. Use software tools like Excel, R, or Python to automate parts of this process.
2. Coding transforms qualitative data into quantitative form by assigning numerical values to different categories. For example, if you're analyzing interview responses, you can categorize the responses into themes and assign numbers to these themes. This makes it easier to analyze the data statistically.
3. Transformation standardizes your data formats to ensure consistency. This means converting all data into a uniform format, such as using the same date format (e.g., YYYY-MM-DD) or ensuring all measurements are in the same unit (e.g., kilograms). Tools like data management software or scripting in Python can help automate these conversions.
Analytical Tools for Research
Software for Qualitative Data Analysis
Qualitative data analysis software like NVivo, ATLAS.ti, and MAXQDA helps manage and analyze non-numerical data. These tools offer features such as data coding, thematic mapping, and visualization, making it easier to uncover patterns and insights.
Software for Quantitative Data Analysis
Quantitative data analysis often involves statistical software like SPSS, SAS, R, and Python. These tools provide robust functionalities for data manipulation, statistical testing, and graphical representation. Selecting the right tool depends on your specific needs, the complexity of your data, and your level of expertise.
Statistical Analysis in Research
Statistical analysis is crucial for interpreting research data accurately. It involves techniques to summarize, describe, and infer from data. Descriptive statistics measure central tendency, dispersion, and distribution shape. Inferential statistics use techniques like t-tests, chi-square tests, and ANOVA to make inferences about populations. Correlation and regression analysis explore relationships between variables and predict outcomes. Utilizing these techniques effectively requires a thorough understanding of statistical principles and careful application to avoid misinterpretation.
Data Interpretation and Presentation
Interpreting data involves drawing meaningful conclusions and explaining their implications. To interpret data effectively, follow these steps:
Ensure clarity by avoiding jargon and making your presentation accessible to a broad audience. Use simple language and clear explanations. Utilize visualization tools like graphs, charts, and tables to present data in an easily understandable format. For instance, you can use bar charts to show comparisons and line graphs to depict trends over time.
Maintain accuracy by representing data truthfully. Double-check your calculations and ensure that visual elements like scales and labels are correct. Avoid exaggerating or distorting the data to mislead your audience.
Focus on relevance by highlighting key findings that directly address your research questions. Identify the most significant data points and explain why they are important. Provide context to help your audience understand the implications of your findings.
Ethical Considerations in Data Analysis
Ethics in data analysis are of much importance to maintaining trust and integrity in research. Common ethical issues include data privacy, informed consent, and avoiding bias. Researchers should adhere to ethical guidelines, ensure transparency in their methods, and respect the confidentiality of participants. Maintaining ethical standards not only protects the rights of participants but also improves the credibility and reliability of your research findings.
Conclusion
Data analysis is the bedrock of credible and impactful research. By understanding and applying best practices in qualitative and quantitative data analysis, selecting appropriate data collection techniques, managing data effectively, and using the right analytical tools, you can improve the quality and reliability of your research findings. With ethical considerations ensured, your research contributes positively to the broader knowledge community.

Data Analytics
Jun 27, 2024Master key concepts in data analytics with practical tips to enhance decision-making and achieve success in your projects and professional growth

Data Analytics
Jul 01, 2024Learn the essential stages of the data analytics workflow to turn your data into valuable business insights and drive growth.

Data Analytics
Jul 01, 2024Learn practical methods for time series analysis for SMEs, including moving averages, exponential smoothing, ARIMA models, and seasonal decomposition techniques.