
Data Analytics
Master Your Data: 7 Advanced Excel Techniques Every Analyst Should Know
Jul 08, 2024
Excel remains an important tool for data analysis across various industries, providing unique flexibility and power. As a professional working in data analysis, financial analysis, or business intelligence, you've likely used Excel for basic tasks.
However, there is a vast array of advanced techniques that can significantly improve your analytical capabilities. Learning these advanced Excel techniques will not only make your work more efficient but also provide you with deeper inside values, enabling you to make better decisions.
In this guide, we'll explore ten advanced Excel techniques that will transform your data handling skills, perfect for business professionals aiming to improve their Excel proficiency.
Advanced Excel Techniques for Data Analysis
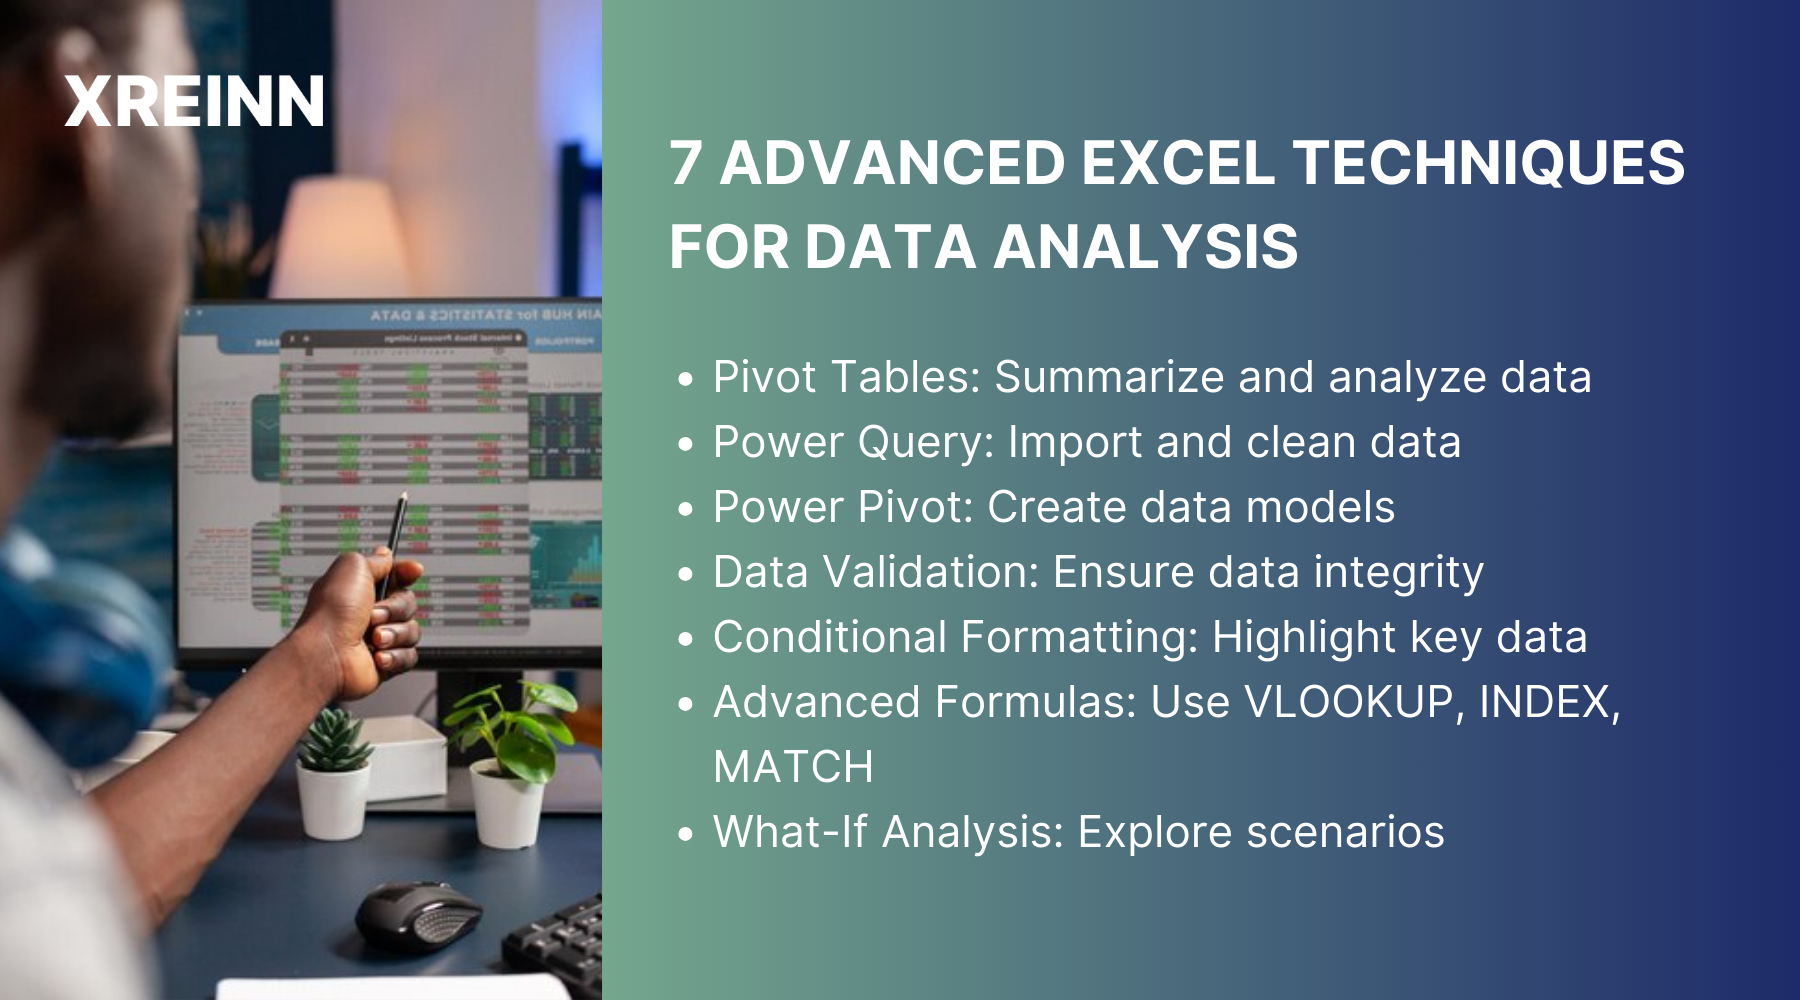
1. Pivot Tables
Pivot Tables are more helpful when it comes to summarizing and analyzing large datasets. They allow you to quickly reorganize and filter data, providing valuable insights with minimal effort.
Creating Pivot Tables
To create a Pivot Table, start by selecting your data range. Then, go to the "Insert" tab and click "PivotTable." Choose where you want the PivotTable to be placed and start exploring your data. This simple step sets the foundation for a more organized and insightful analysis.
Advanced Tips
For advanced usage, try using slicers to filter data interactively, which makes it easy to view different subsets of your data. Adding calculated fields for custom calculations can make your analysis more powerful by allowing you to perform additional calculations on the fly. Additionally, creating Pivot Charts to visualize your data dynamically can provide deeper insights and make your findings more accessible. Learning Pivot Tables will save you hours of manual data manipulation and open up new ways to analyze your data efficiently.
2. Power Query
Power Query is a powerful tool for importing, transforming, and cleaning data, especially useful when dealing with large datasets from multiple sources. Power Query will streamline your data preparation process, ensuring you work with clean and accurate data.
Getting Started with Power Query
1. Go to the "Data" tab and select "Get Data."
2. Choose your data source (e.g., Excel file, database, web page).
3. Load the data into Excel by clicking "Load" or "Load to."
4. With Power Query, you can perform various data transformations to clean and prepare your data.
Data Transformations
1. Remove Duplicates: Click on the column header, then go to "Home" > "Remove Duplicates."
2. Filter Rows: Click on the filter icon in the column header and select the criteria.
3. Split Columns: Select the column, then go to "Home" > "Split Column" and choose your method (e.g., by delimiter).
4. Add Custom Columns: Go to "Add Column" > "Custom Column" and write your custom formula.
Advanced Techniques
1. Using M Language: For advanced data transformations, click on "Advanced Editor" in the "Home" tab to write custom M code. This allows for more complex and customized data manipulation.
2. Merging Queries: To combine data from different sources, go to "Home" > "Merge Queries." Select the queries you want to merge and define the join type.
3. Using Parameters: Create parameters to make your queries more dynamic. Go to "Manage Parameters" in the "Home" tab and define your parameters. Then, reference these parameters in your queries to adjust the data source or filter criteria dynamically.
3. Power Pivot
Power Pivot allows you to create sophisticated data models and handle large datasets with ease. It's an essential tool for anyone dealing with complex data analysis. To create data models, load your data into Power Pivot by selecting "Manage" from the Power Pivot tab. Then, create relationships between tables to build a comprehensive data model.
Advanced Techniques
Using DAX (Data Analysis Expressions) for advanced calculations can improve your data analysis capabilities. Adding calculated columns with complex formulas allows for more detailed insights. Creating measures for aggregated calculations helps in summarizing large datasets effectively. With Power Pivot, you can analyze massive datasets without compromising on performance.
4. Data Validation
Data validation ensures the integrity of your data by restricting the type of data that can be entered into a cell. This is important for maintaining data quality. To set up data validation, select the cells you want to validate, go to the "Data" tab, and click "Data Validation." Set your validation criteria, such as a list, date, or custom formula.
Advanced Tips
Creating custom validation formulas allows you to set more complex rules for your data. Dynamic drop-down lists that update automatically based on your data can make your sheets more interactive and user-friendly. Implementing data validation will help you avoid errors and maintain consistency in your datasets.
5. Conditional Formatting
Conditional formatting allows you to highlight cells that meet specific criteria, making it easier to spot trends and outliers in your data. To apply conditional formatting, select your data range, go to the "Home" tab, and click "Conditional Formatting." Choose your formatting rules, such as color scales, data bars, or icon sets.
Advanced Techniques
Using formulas for custom formatting rules enables you to highlight cells based on complex conditions. Creating heat maps to visualize data density and distribution can make your analysis more intuitive. Adding icon sets to represent different data ranges provides a quick visual cue for data interpretation. Conditional formatting will improve your data visualization, making your analysis more intuitive.
6. Advanced Formulas and Functions
Excel offers a wide range of advanced functions that can simplify complex calculations and data manipulation. Functions like VLOOKUP and HLOOKUP allow you to look up data in a table, while INDEX and MATCH provide more flexible alternatives. Array formulas enable you to perform multiple calculations on a range of cells simultaneously. Advanced Techniques
Essential Functions
VLOOKUP and HLOOKUP: Look up data in a table. Example: =VLOOKUP(lookup_value, table_array, col_index_num, [range_lookup]).
INDEX and MATCH: More flexible alternatives to VLOOKUP. Example: =INDEX(array, row_num, [column_num]) combined with =MATCH(lookup_value, lookup_array, [match_type]).
Array Formulas: Perform multiple calculations on a range. Example: {=SUM(A1:A10*B1:B10)}.
Advanced Techniques
Combining Functions: Nest functions for complex calculations. Example: =INDEX(B2:B10, MATCH("lookup_value", A2:A10, 0)).
XLOOKUP: A powerful lookup function. Example: =XLOOKUP(lookup_value, lookup_array, return_array, [if_not_found], [match_mode], [search_mode]).
Dynamic Arrays: Automatically expand formulas. Example: =FILTER(array, include, [if_empty]).
These advanced functions will enhance your data analysis capabilities, making your work more efficient and effective.
7. What-If Analysis
What-If Analysis tools allow you to explore different scenarios and their potential outcomes, which is invaluable for forecasting and decision-making. Goal Seek helps you find the input values needed to achieve a specific goal. Scenario Manager allows you to create and compare different scenarios. Data Tables enable you to analyze the impact of changing multiple variables.
Using What-If Analysis - Goal Seek
1. Go to the "Data" tab.
2. Click on "What-If Analysis" in the Forecast group.
3. Select "Goal Seek."
4. In the Goal Seek dialog box, set the "Set cell" to the cell you want to change, "To value" to your desired outcome, and "By changing cell" to the input cell that Excel should adjust.
Scenario Manager
1. Go to the "Data" tab.
2. Click on "What-If Analysis" and choose "Scenario Manager."
3. Click "Add" to create a new scenario.
4. Enter a name for the scenario and select the changing cells.
5. Input the values for each scenario and click "OK."
Data Tables
1. Set up your data table with input values in the first row or column.
2. Select the data range for your table.
3. Go to the "Data" tab.
4. Click on "What-If Analysis" and select "Data Table."
5. For a one-variable data table, enter the cell reference for the input cell in the "Column input cell" or "Row input cell" box.
6. For a two-variable data table, enter the cell reference for the input cells in both boxes.
Conclusion
Learning these seven advanced Excel techniques will equip you to tackle any data analysis challenge with confidence. As a data professional, learning these skills will save you time, improve the accuracy of your analyses, and provide you with powerful tools to uncover deeper insights from your data.
By incorporating these advanced features into your workflow, you'll be able to streamline your processes, make more informed decisions, and ultimately drive better outcomes for your business and organization. Dive into these techniques, practice them, and watch how your proficiency in Excel transforms your data analysis capabilities.

Data Analytics
Jun 27, 2024Master key concepts in data analytics with practical tips to enhance decision-making and achieve success in your projects and professional growth

Data Analytics
Jul 01, 2024Learn the essential stages of the data analytics workflow to turn your data into valuable business insights and drive growth.

Data Analytics
Jul 01, 2024Learn practical methods for time series analysis for SMEs, including moving averages, exponential smoothing, ARIMA models, and seasonal decomposition techniques.