
Research
4 Best Practices for Data Collection in Market Research

Effective data collection is the foundation of successful market research. To truly understand your customer behaviors, needs, and interests, you need to gather the right data. Whether you're launching a new product, exploring a new market, or seeking deeper insights into your existing customers, data collection is important. It provides valuable insights that guide your decision-making, allowing you to identify trends, respond to changes, and customize your offerings to meet customer demands. In short, data collection is essential for making informed decisions that propel your business forward.
In this guide, we’ll explore the best practices for data collection in market research to ensure you gather accurate, actionable, and relevant information.
Best Practices for Data Collection in Market Research
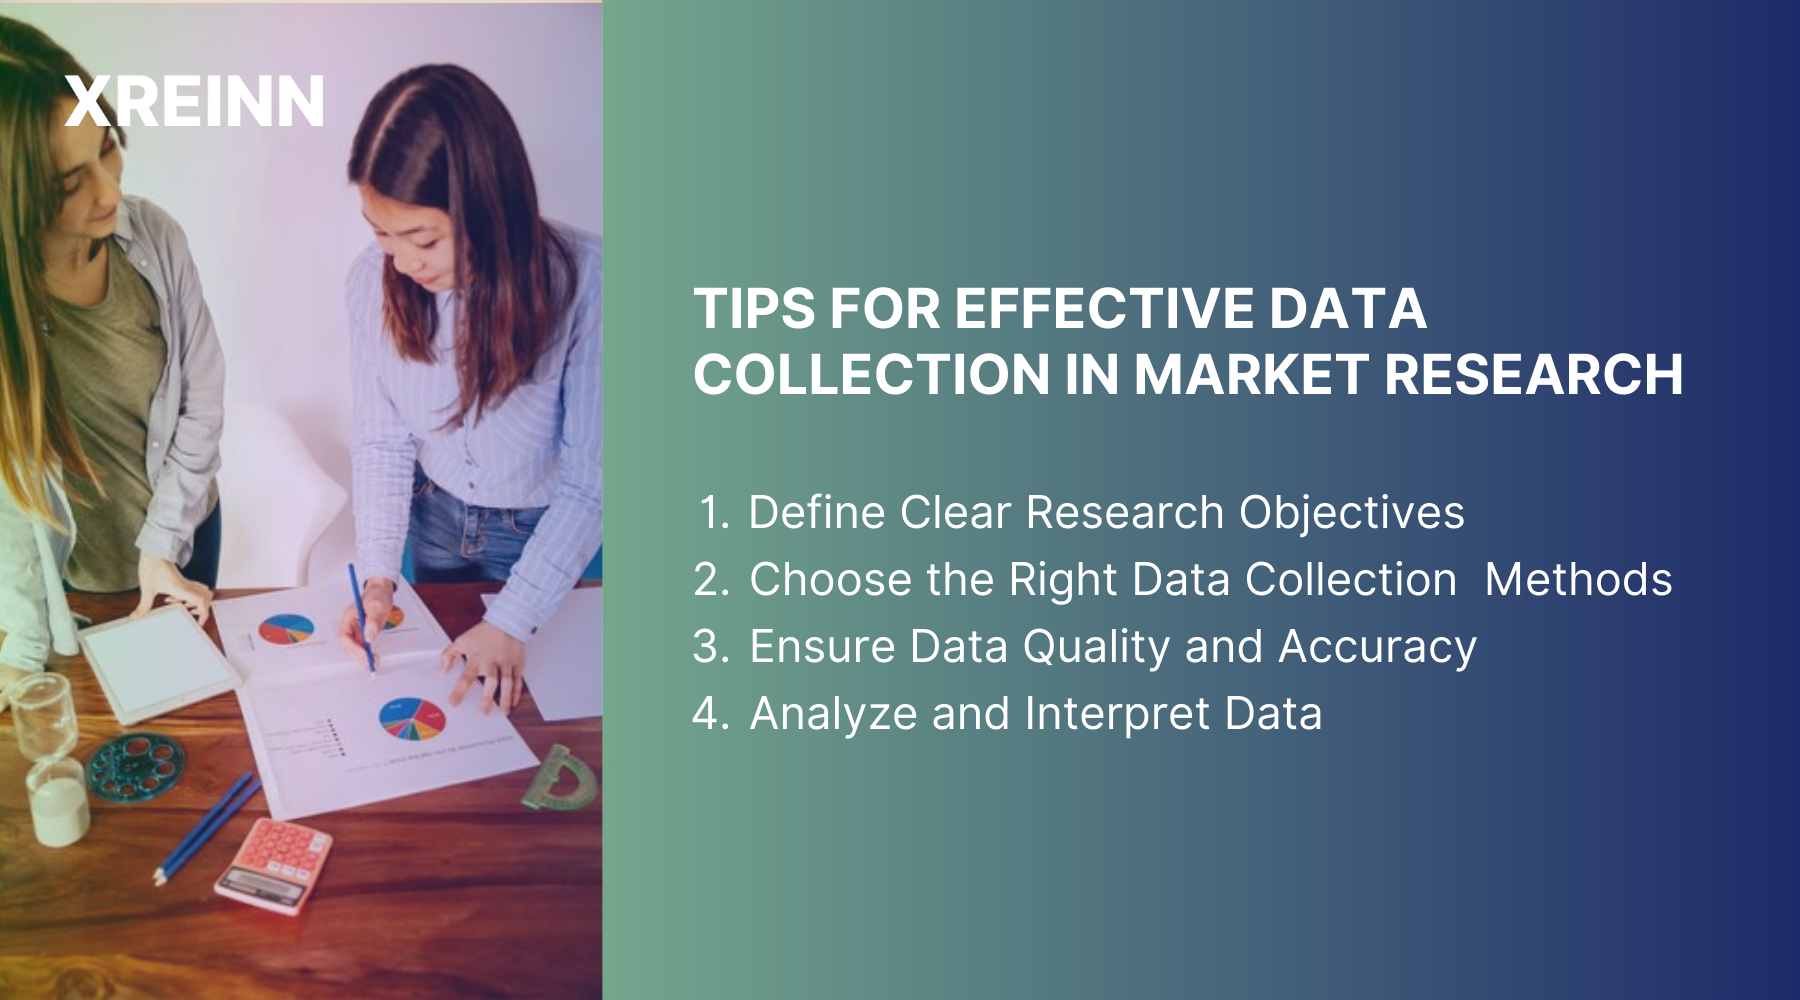
1. Define Clear Research Objectives
Before you start collecting data, you need to be very clear about what you want to achieve. Think of defining your research objectives as building the foundation for your entire project. Having well-defined goals saves you time and resources and ensures your efforts match your business goals.
Identifying Your Goals
First, ask yourself what you hope to achieve with your target research. Are you looking to understand customer satisfaction better, explore new markets, or get a handle on your competitors? By clearly identifying your primary goals, you can target your research to focus on what matters. Organize these goals down into smaller tasks that provide focus and direction, making the whole process feel less complicated.
Specifying Your Research Questions
Once you’ve set your goals, develop specific questions that directly address your objectives. These questions should be clear and actionable, guiding you toward collecting the most relevant data.
For example, if you're interested in customer satisfaction, you might ask, "What features do our customers love the most?" or "How does our user experience measure up against our competitors?" These questions act like a compass, keeping you focused on gathering data that truly impacts your business.
Identifying Your Target Audience
Identifying your target audience is just as important as knowing your research goals. Are you focusing on existing customers, potential leads, or a specific demographic? By focusing on a specific audience, you can customize your data collection methods to gather insights that are not only relevant but also actionable. Use targeting techniques to categorize your audience based on demographics, interests, or behavior patterns. You will be able to reach the right people and produce meaningful results when you do this.
2. Choose the Right Data Collection Methods
To collect meaningful data, you must clearly understand your objectives and know exactly who your target audience is. Basic surveys and interviews are no longer sufficient on their own. Today, you need a strategic approach that utilizes modern tools and techniques.
Surveys and Questionnaires
Surveys and questionnaires are still popular for collecting quantitative data, but their effectiveness depends on their design. Consider using responsive surveys that change based on the respondent’s answers, offering a more personalized experience. Mix in various question types like rating scales and matrix questions to capture detailed responses. And don’t forget about A/B testing to refine your surveys and improve response rates.
Interviews
Interviews provide qualitative insights that are invaluable for understanding deeper motivations and behaviors. Conduct semi-structured interviews with a mix of prepared questions and the flexibility to explore unexpected topics. Engage in active listening to build understanding and encourage real responses. Use transcription and coding software to analyze qualitative data efficiently, identifying patterns and themes that offer actionable insights.
Focus Groups
Focus groups offer a lively environment for gathering distinct perspectives. Choose participants who reflect your target audience's diversity, and encourage open discussion and debate. Record the sessions for analysis, and use qualitative data analysis tools to uncover key insights that drive decision-making.
Observational Research
Observational research involves watching subjects in their natural environments, offering a window into real-world behaviors. Develop a structured observation plan outlining what you want to study and how you'll record your findings. Keep your methods unnoticed to ensure authentic observations, and analyze patterns to draw meaningful conclusions about consumer habits and preferences.
Online Analytics and Social Listening
In the digital world, online analytics and social listening are essential tools for market research. Use web analytics platforms to track user behavior on your website, such as page views, bounce rates, and conversion metrics. Social listening tools help monitor brand mentions, sentiment analysis, and trending topics across social media platforms. By integrating data from various sources, you create a comprehensive view of your audience, enabling data-driven decisions that resonate with your market.
3. Ensure Data Quality and Accuracy
Collecting data is only part of the equation; ensuring its quality and accuracy is equally crucial. Without reliable data, you risk making decisions based on flawed insights, which can have negative consequences for your business.
Using Reliable Sources
Always verify the credibility of your data sources. Depend on reputable databases, industry reports, and trusted research firms to supplement your primary data collection. Cross-check information from multiple sources to ensure consistency and accuracy, reducing the risk of bias or error.
Implementing Data Validation Techniques
Data validation is significant for keeping your datasets accurate and reliable. For quick checks on smaller datasets, tools like Excel and Google Sheets let you set rules and spot inconsistencies easily. For more complex tasks, R and Python are great options. They have libraries like validate and pandas that help detect outliers and perform regression analysis. OpenRefine is another handy tool for cleaning and organizing data by finding errors and standardizing formats. Finally, using statistical methods like regression analysis and outlier detection can show you hidden patterns and ensure your data's integrity.
Addressing Bias
Bias can affect your results, leading to inaccurate conclusions. Be mindful of potential biases in your data collection process. Design surveys that avoid leading questions and ensure a diverse representation in your sample to reduce selection bias. Techniques like multiple sampling can help achieve a balanced and representative dataset.
Maintaining Consistency
Consistency in data collection methods is essential for comparability and reliability. Standardize your procedures and train your team to adhere to these protocols consistently. Use data harmonization techniques to align data formats and structures from different sources, ensuring compatibility and coherence.
4. Analyze and Interpret Data
After collecting your data, the real challenge begins: analyzing and interpreting it to extract actionable insights that drive your business forward.
Organizing Your Data
Start by cleaning and organizing your data to ensure accuracy and consistency. Remove duplicates, correct errors, and address any missing data points. Group data into relevant categories or themes to simplify the analysis, making it easier to identify patterns and trends.
Employing Statistical Analysis
Use statistical analysis techniques to uncover relationships and insights in your data. Descriptive statistics can help summarize key metrics and trends, providing a clear overview of your findings. Inferential statistics allow you to make predictions about broader populations, guiding strategic decisions with evidence-based insights.
Visualizing Your Findings
Data visualization is a powerful tool for presenting complex data clearly and concisely. Choose the right visualization techniques, such as bar charts, line graphs, or scatter plots, to effectively represent your data. Use visuals to tell a compelling story, guiding your audience through the insights and conclusions that matter most.
Drawing Actionable Conclusions
Interpret your findings and draw conclusions that inform your business decisions. Relate your insights to your original research objectives, ensuring your conclusions are relevant and actionable. Use these insights to develop strategic recommendations that address key challenges and opportunities affecting your business.
Conclusion
Data collection is the foundation of successful market research for any business. By employing advanced techniques and best practices, you can ensure that your efforts provide accurate, relevant, and actionable insights. From defining clear research objectives to choosing the right data collection methods and ensuring data quality, each step is essential for obtaining valuable insights that support business growth. Remember, data collection is an ongoing process. Continuously monitor and refine your strategies to respond to market trends and business needs.

Data Analytics
Jun 27, 2024Master key concepts in data analytics with practical tips to enhance decision-making and achieve success in your projects and professional growth

Data Analytics
Jul 01, 2024Learn the essential stages of the data analytics workflow to turn your data into valuable business insights and drive growth.

Data Analytics
Jul 01, 2024Learn practical methods for time series analysis for SMEs, including moving averages, exponential smoothing, ARIMA models, and seasonal decomposition techniques.