
Data Analytics
Understanding Data Interpretation: Efficient Techniques for Accurate Analysis
Jul 08, 2024
With the increasing importance of data, the ability to interpret vast amounts of information is more crucial than ever. Businesses must transform raw data into meaningful insights to stay competitive and make informed decisions. Effective data interpretation identifies trends, identifies opportunities, and addresses potential challenges. Whether you’re a business owner, analyst, or researcher, mastering the art of data interpretation can empower you to leverage data for strategic success and innovation.
Let’s explore how you can interpret data efficiently to Initiate better business outcomes.
What Is Data Interpretation?
Data interpretation is the process of analyzing data to find useful insights and draw meaningful conclusions. It involves looking at patterns, relationships, and trends in the data to uncover important information. Instead of just collecting and organizing data, data interpretation is about understanding the data and finding valuable knowledge from it.
This process helps businesses make informed decisions and identify opportunities for improvement. By interpreting data effectively, companies can stay ahead of their competition and better meet their customers' needs
How to Interpret Data?
When analyzing data, analysts must distinguish between correlation, causation, and coincidences, while also recognizing other potential biases. They must consider all contributing factors to understand how results are generated. Using various data interpretation methods helps businesses make sense of numerical data that has been collected, analyzed, and presented.
Establishing a preferred method for data interpretation provides structure, but different teams may employ diverse approaches, leading to inconsistencies, duplicated efforts, conflicting solutions, and inefficiencies.
Let's explore the two primary processes of data interpretation: qualitative and quantitative analysis.
Qualitative Data Interpretation
Qualitative data analysis involves describing data using descriptive statistics rather than numerical values. This type of analysis focuses on narrative data collected through methods such as observations, focus groups, secondary research, and interviews. Qualitative data must be coded to group and label information into clear themes, following three steps: noticing things, collecting data, and thinking about the findings.
Quantitative Data Interpretation
Quantitative data interpretation involves analyzing numerical data using statistical methods. This includes calculating the mean (average), standard deviation (how spread out the responses are), and frequency distribution (how often a response occurs). Key methods include.
- Regression Analysis: Uses past data to predict future outcomes.
- Cohort Analysis: Studies groups with common features over time.
- Predictive Analysis: Forecasts future trends.
- Prescriptive Analysis: Makes decisions based on predictions.
- Conjoint Analysis: Understands how users value different features.
- Cluster Analysis: Groups data to find patterns.
Why is Data Interpretation Important?
In today’s world, understanding and using data is essential for many industries. Here are some key reasons why data interpretation is so important:
Informed Decision-Making
Data interpretation helps people and businesses make smart decisions based on facts and evidence. This means decisions are backed by data, not just guesses or feelings.
Identifying Opportunities and Risks
By looking at data, businesses can find new chances for growth and innovation. They can see patterns and trends that show new market segments, what customers like, and upcoming trends. At the same time, data interpretation helps spot potential problems and risks that need to be managed.
Optimizing Performance
Analyzing data helps businesses find ways to improve. It shows where there are delays, inefficiencies, and opportunities for better performance in areas like supply chain management, production, and customer service.
Enhancing Customer Experience
Understanding customer data helps businesses see how customers behave and what they prefer. This allows them to personalize products and services, improve the customer experience, and create marketing strategies that effectively target different customer groups.
Predictive Analytics and Forecasting
Data interpretation allows businesses to predict future trends and plan accordingly. By looking at historical data patterns, businesses can make forecasts and predictions, helping them make proactive decisions and reduce risks.
Evidence-Based Research and Policy Making
In areas like healthcare, social sciences, and public policy, data interpretation is crucial for conducting research and making policies based on evidence. Analyzing relevant data helps researchers and policymakers identify trends, assess the effectiveness of actions, and make informed decisions that positively impact society.
Competitive Advantage:
Businesses that are good at interpreting data gain an edge over their competitors. Using data insights, they can make informed strategic decisions, innovate quickly, and respond swiftly to market changes. This helps them stay ahead in today’s fast-paced business world.
Data Interpretation Best Practices & Tips
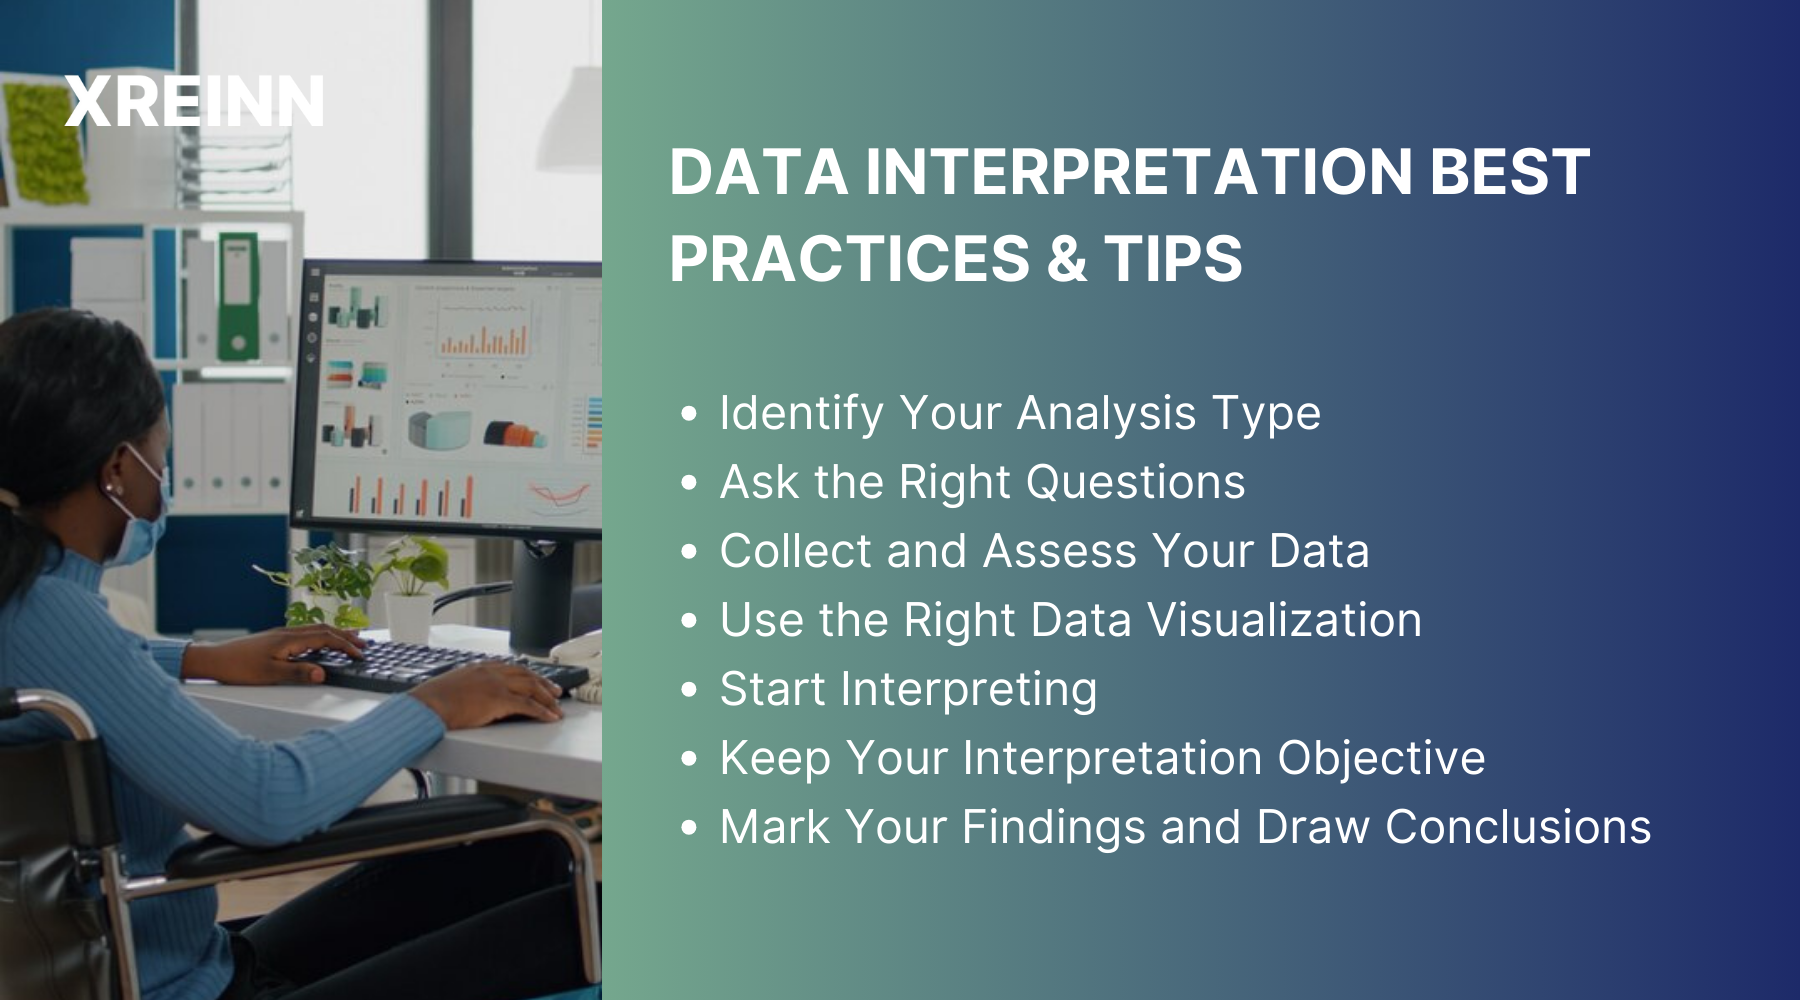
Data analysis and interpretation are essential for making informed decisions and drawing sound conclusions. Here are some best practices and tips to help you manage and interpret your data effectively.
Identify Your Analysis Type
The first step in interpreting data is to determine whether you will perform qualitative or quantitative analysis. Qualitative analysis involves observing, documenting, and interviewing to gather narrative data. Quantitative analysis, on the other hand, involves analyzing numerical data using statistical methods.
Ask the Right Questions
Start by defining the goals and objectives of your analysis. Ask critical questions such as: What are my analysis goals? What method will I use? Who will use this data? What main question am I trying to answer? This clarity will guide your data collection and analysis process.
Collect and Assess Your Data
Gather your data based on the type of analysis you're conducting. Use professional data analysis tools to make this process easier and more accurate. Ensure the data quality is appropriate by checking the sample size, data collection methods, and the reliability of sources.
Use the Right Data Visualization
Choose the correct data visualization to make your data more understandable. Common visualizations include:
- Bar Charts: Show relationships between variables using rectangular bars.
- Line Charts: Display trends over time, such as sales growth.
- Pie Charts: Represent proportions of a whole.
- Tables: Present raw data for easy comparison of individual values.
Modern BI dashboards can combine these visualizations into a cohesive view, making data interpretation more efficient.
Start Interpreting
Begin concluding your data. If you have research questions or hypotheses, look for ways to validate them. If not, search for patterns and relationships in the data. Stay curious and be ready to ask new questions if necessary.
Keep Your Interpretation Objective
Avoid bias by sharing your findings with others, such as research partners or future data users. This can help maintain objectivity and ensure your interpretation is reliable.
Mark Your Findings and Draw Conclusions
Identify key observations and trends in your data. Compare your findings with similar studies to provide context. Reflect on your reasoning, being mindful of potential pitfalls like correlation versus causation, bias, and inaccurate data. Develop conclusions and make recommendations based on your findings.
Conclusion
Interpreting data efficiently is a skill that can significantly benefit your business. By understanding and applying the principles of qualitative and quantitative data interpretation, you can make informed decisions, optimize performance, and enhance customer experiences. Data interpretation not only helps in predicting future trends and making proactive decisions but also provides a competitive edge in the market.
By following best practices and using the right tools, you can turn complex data into actionable insights, ensuring your business stays ahead in today’s data-driven world.

Data Analytics
Jun 27, 2024Master key concepts in data analytics with practical tips to enhance decision-making and achieve success in your projects and professional growth

Data Analytics
Jul 01, 2024Learn the essential stages of the data analytics workflow to turn your data into valuable business insights and drive growth.

Data Analytics
Jul 01, 2024Learn practical methods for time series analysis for SMEs, including moving averages, exponential smoothing, ARIMA models, and seasonal decomposition techniques.