
Data Analytics
Data Analysis with R: A Comprehensive Guide for Growing Your SME
Jul 08, 2024
Running a small or medium-sized business (SME) comes with many challenges, especially when it comes to making data-driven decisions. You might struggle with limited resources, lack of in-depth analytical tools, or the inability to interpret vast amounts of data effectively.
These challenges can hinder your growth and competitiveness. However, R, a powerful and functional programming language, can reshape your data analysis capabilities. For business owners, understanding R means having the ability to make the best decisions, optimize operations, and gain a competitive edge in the market.
This comprehensive guide will help you use the full potential of R, addressing your needs from basic data manipulation to advanced statistical analysis and visualization.
1. Understanding R: The Foundation
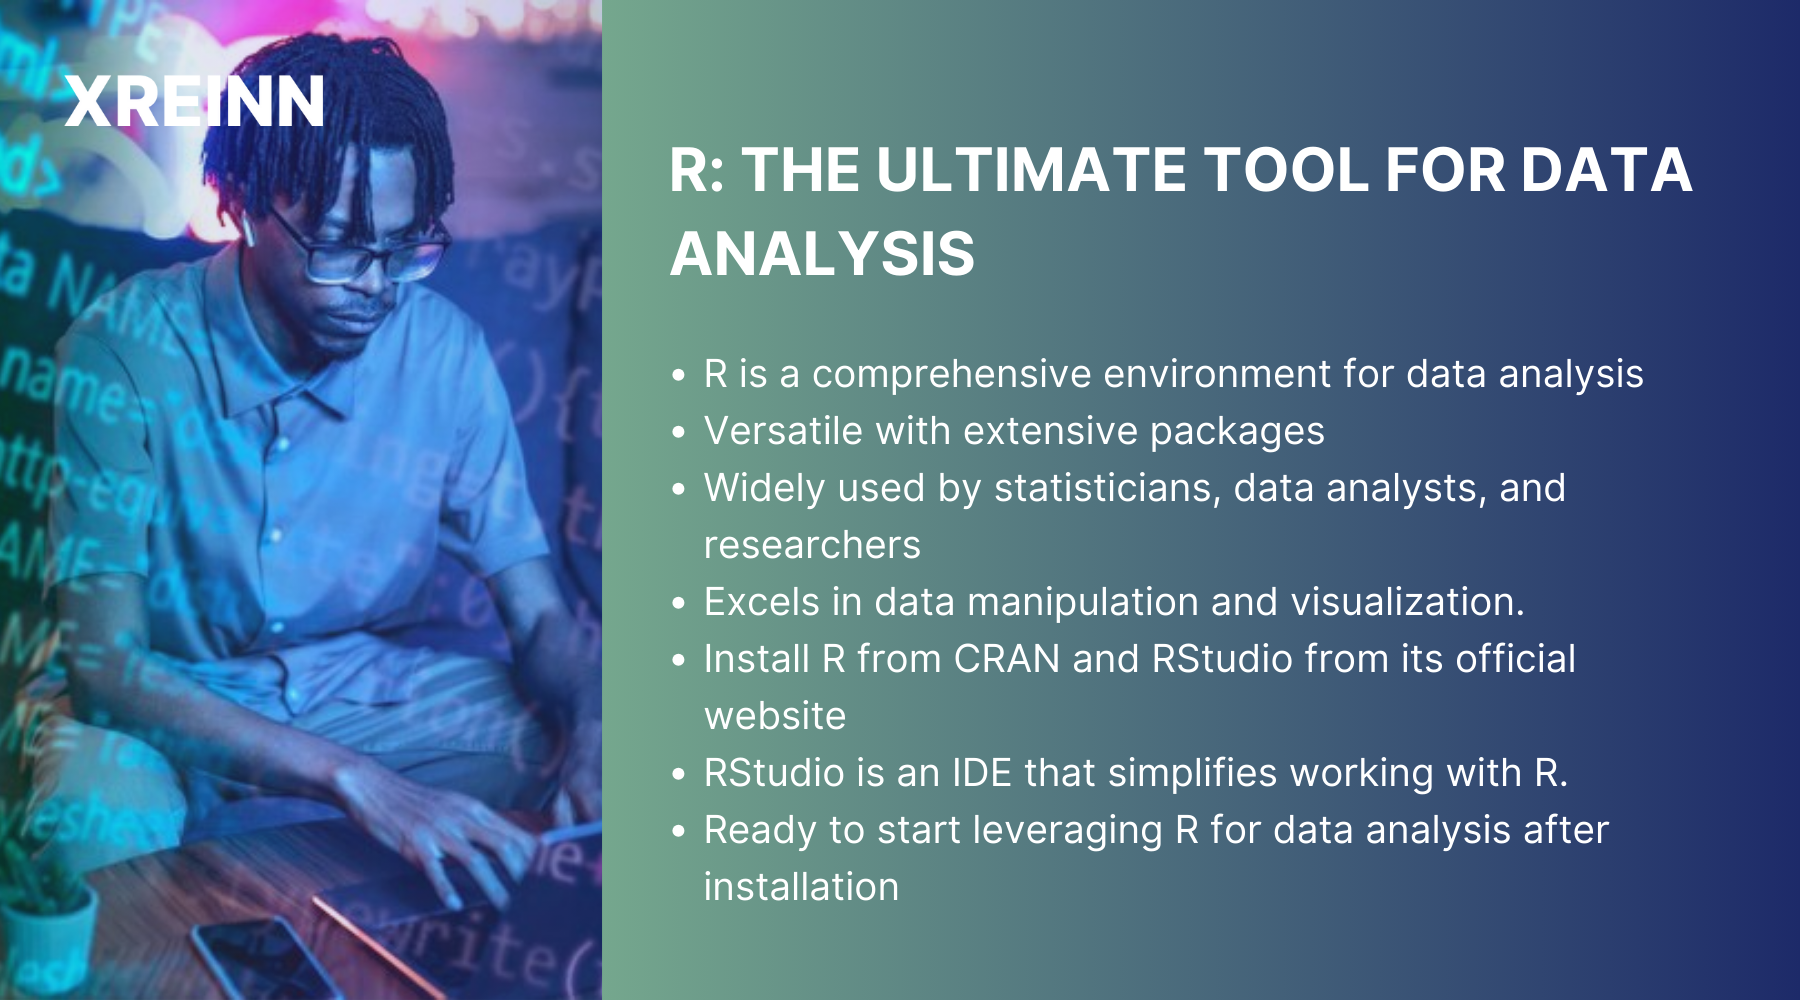
R is not just a programming language; it’s a complete environment for data analysis. Its popularity stems from its versatility and the vast array of packages that extend its functionality. R is used by statisticians, data analysts, and researchers for its powerful data manipulation and visualization capabilities.
To get started, you’ll need to install R and RStudio, an integrated development environment (IDE) that makes working with R much easier. Download R from CRAN (Comprehensive R Archive Network) and RStudio from its official website. Once installed, you’ll be ready to go into the world of R.
2. Getting Started with R: Basic Concepts
Starting with R might seem a bit challenging, but understanding its basic concepts will help you build a strong foundation. R’s syntax is straightforward and intuitive once you get the hang of it.
Begin with simple commands to get comfortable. For instance, use the c() function to create a vector or the data.frame() function to create a data frame. Familiarize yourself with different data types such as numeric, character, and logical.
Understanding data structures like vectors, matrices, data frames, and lists will be important as you go deeper into data analysis. Importing data is essential; use functions like read.csv() for CSV files or read.table() for text files. Similarly, exporting data can be done using write.csv() or write.table().
3. Data Manipulation with R
Data manipulation is an important step in the data analysis process. R offers powerful packages like dplyr and tidyr that simplifies this task. With dplyr, you can filter rows, select columns, arrange data, and create new variables effortlessly. Here’s an example: to filter rows where the value of a column is greater than a certain number, you can use the filter() function. tidyr complements dplyr by making it easy to tidy your data, and transforming it into a format that’s ready for analysis.
Functions like gather() and spread() help in reshaping your data. By understanding these packages, you can efficiently clean, transform, and prepare your data for further analysis.
4. Data Visualization in R
Visualizing data is important to understand trends, patterns, and outliers. R excels in this area with packages like ggplot2 and lattice. ggplot2 is particularly popular for its elegant and distinct plotting capabilities. It uses a layered approach to build plots, making it highly customizable. Start by creating simple plots like bar charts, line graphs, and scatter plots.
For instance, use ggplot(data, aes(x, y)) + geom_point() to create a scatter plot. As you gain confidence, experiment with more complex visualizations, adding layers and customizing aesthetics to suit your needs. Good data visualization can turn raw data into compelling stories that drive decision-making.
5. Statistical Analysis with R
Statistical analysis allows you to extract deeper insights from your data. R provides a comprehensive suite of functions and packages for this purpose. You can perform basic statistical tests like t-tests or chi-square tests using built-in functions.
For more complex analyses, use packages like MASS or car. Regression analysis, a fundamental technique, can be done using the lm() function for linear models. Similarly, aov() is used for the analysis of variance (ANOVA). Hypothesis testing, another important aspect, helps in making the best decisions based on your data. R’s capabilities in statistical analysis are extensive, allowing you to perform a wide range of tests and analyses with ease.
6. Advanced Data Analysis Techniques
Once you’re comfortable with the basics, you can explore advanced data analysis techniques in R. This includes machine learning, time series analysis, and more. For machine learning, packages like caret provide tools for building and evaluating predictive models.
Time series analysis, essential for forecasting, can be done using packages like forecast and tseries. These tools enable you to handle complex data scenarios and make accurate predictions. By integrating these advanced techniques into your skill set, you can tackle a broader range of data analysis challenges and provide deeper insights.
7. Working with R Data Packages
R’s strength lies in its extensive collection of packages. These packages extend R’s capabilities, making it a powerful tool for various data analysis tasks. To find and install packages, use the install.packages() function. For instance, install.packages("dplyr") installs the dplyr package. Once installed, use library(package_name) to load the package into your session.
Essential packages for data analysis include dplyr for data manipulation, ggplot2 for data visualization, and caret for machine learning. Exploring and utilizing these packages will significantly enhance your productivity and analytical capabilities.
8. Best Practices for Efficient Data Analysis with R
Efficiency is key in data analysis. Adopt best practices to ensure your R scripts are optimized and easy to maintain. Comment your code to make it understandable. Use consistent naming conventions and organize your scripts logically. Break down complex tasks into smaller, manageable functions.
Regularly update your packages to benefit from the latest features and improvements. Avoid common pitfalls like overfitting in statistical models or ignoring data assumptions. By following these best practices, you’ll ensure your data analysis processes are powerful, reproducible, and efficient.
9. Debugging and Error Handling in R
Even the best scripts can run into issues. Learning how to debug and handle errors effectively can save you time and frustration. R provides various tools for this purpose. Use the traceback() function to understand where an error occurred. The debug() function allows you to step through your code line by line.
Additionally, tryCatch() helps you handle errors gracefully, enabling your script to continue running even when it encounters issues. Mastering these techniques will make you more proficient and confident in using R for data analysis.
Conclusion
Adopting data analysis with R can be a transformative step for your small or medium-sized enterprise. Improved decision-making is possible by converting raw data into actionable insights, enabling more informed and strategic business decisions that directly impact your bottom line. The powerful functionalities of R packages like dplyr for data manipulation and ggplot2 for data visualization to streamline your data processes, saving valuable time and resources.
Additionally, advanced analytical techniques such as machine learning and time series forecasting provide a competitive advantage, allowing you to anticipate trends and optimize operations effectively. Make the most of it, and unlock the full potential of your data to drive your business forward.

Data Analytics
Jun 27, 2024Master key concepts in data analytics with practical tips to enhance decision-making and achieve success in your projects and professional growth

Data Analytics
Jul 01, 2024Learn the essential stages of the data analytics workflow to turn your data into valuable business insights and drive growth.

Data Analytics
Jul 01, 2024Learn practical methods for time series analysis for SMEs, including moving averages, exponential smoothing, ARIMA models, and seasonal decomposition techniques.